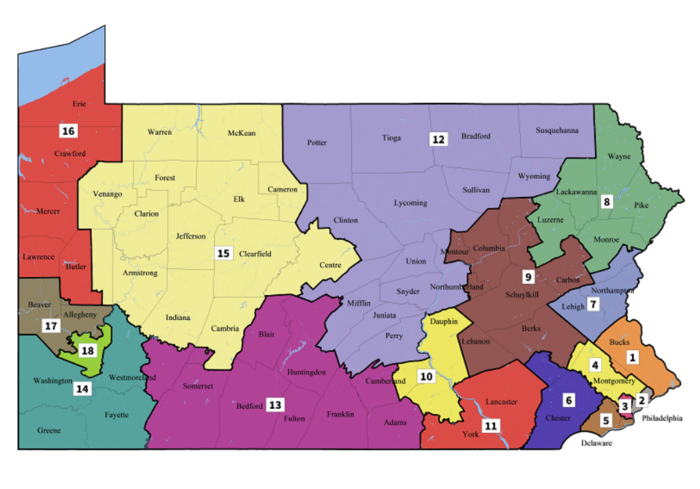
Congressional district plans in Pennsylvania (2011 map and 2018 remedial map)
![]() This article does not contain the most recently published data on this subject. If you would like to help our coverage grow, consider donating to Ballotpedia.
This article does not contain the most recently published data on this subject. If you would like to help our coverage grow, consider donating to Ballotpedia.
redistricting procedures |
|---|
2020 |
On January 22, 2018, Pennsylvania's state supreme court struck down the state's congressional district map, finding that the map constituted an illegal partisan gerrymander. On February 19, 2018, the court adopted a remedial map for use in the 2018 election cycle. Pennsylvania Republicans filed suit in federal district court to prevent implementation of the new map. The district court dismissed the suit on March 19, 2018. State Republicans also petitioned the Supreme Court of the United States to stay the state supreme court's order pending appeal. The court rejected this request on March 19, 2018.
District locations and numbers differed between the two maps (i.e., the original map, adopted by the legislature in 2011, and the remedial map enforced by the state supreme court in 2018). The map adopted by the state supreme court split 13 counties; the 2011 map split 28 counties. Had the 2018 map been in place during the 2016 presidential election, Donald Trump (R) would have won 10 districts and Hillary Clinton (D) would have won eight. In 2016, at which time the 2011 map was in place, Trump carried 12 districts to Clinton's six.
This article compares the original 2011 map and the remedial 2018 map. Map images are provided below. For more complete information on redistricting in Pennsylvania, see this article.
2018 remedial map
The image presented below is the remedial congressional district map enacted by the state supreme court in 2018. This map took effect beginning with the November 6, 2018, general election cycle.
Use the interactive map below to view the districts in greater detail.
2011 original map
The image presented below is the original congressional district map adopted by the state legislature in 2011. Congressional elections were conducted using this map in 2012, 2014, and 2016.
Differences between the 2011 and 2018 maps
The table below details differences between the 2011 and 2018 maps. The first column includes district numbers under the 2018 remedial map (links direct readers to detailed images of the 2018 district maps). The second column indicates the 2011 districts, or portions thereof, that constitute the 2018 districts.
| 2018 map district | 2011 districts (or portions thereof) incorporated into 2018 districts |
|---|---|
| District 1 | Districts 7, 8, and 13 |
| District 2 | Districts 1 and 13 |
| District 3 | Districts 1 and 2 |
| District 4 | Districts 2, 6, 7, 8, and 13 |
| District 5 | Districts 1, 2, and 7 |
| District 6 | Districts 1, 6, 7, and 16 |
| District 7 | Districts 10, 15, and 17 |
| District 8 | Districts 10, 11, and 17 |
| District 9 | Districts 6, 11, 15, 16, and 17 |
| District 10 | Districts 4, 11, and 15 |
| District 11 | Districts 4, 7, and 16 |
| District 12 | Districts 5, 10, and 11 |
| District 13 | Districts 4, 5, 9, 11, 12, and 18 |
| District 14 | Districts 9, 12, and 18 |
| District 15 | Districts 3, 5, 9, and 12 |
| District 16 | Districts 3, 5, and 12 |
| District 17 | Districts 12, 14, and 18 |
| District 18 | Districts 12, 14, and 18 |
See also
- Redistricting in Pennsylvania
- Redistricting
- League of Women Voters of Pennsylvania v. the Commonwealth of Pennsylvania
External links
- All About Redistricting
- National Conference of State Legislatures, "Redistricting Process"
- FairVote, "Redistricting"
Footnotes
 |
State of Pennsylvania Harrisburg (capital) |
|---|---|
| Elections |
What's on my ballot? | Elections in 2026 | How to vote | How to run for office | Ballot measures |
| Government |
Who represents me? | U.S. President | U.S. Congress | Federal courts | State executives | State legislature | State and local courts | Counties | Cities | School districts | Public policy |


