New Bedford Public Schools elections (2017)
2019 →
← 2015 |
|---|
|
|
| Enrollment (14-15) |
|
|
Three of the seven seats on the New Bedford Public Schools School Committee were up for nonpartisan general election on November 7, 2017. The mayor of New Bedford, who served as an ex-officio member of the board, was also up for election, but that election was not covered by Ballotpedia as the city fell outside of municipal elections coverage.[1] Incumbent Josh Amaral and newcomers Colleen Dawicki and John Oliveira won the election, defeating Rich Porter.[2] Margaret Amaral initially filed to run in the election, but she withdrew from the race.[3][4]
The 2017 election attracted fewer candidates than the district's 2013 and 2015 elections attracted. Click here to read about election trends in the district.
Elections
Voter and candidate information
The New Bedford School Committee consists of seven members, one of which is the mayor of New Bedford. The six regular school committee members are elected to four-year terms. Elections are held on a staggered basis every November of odd-numbered years so that three seats are on the ballot each election year.[1] Primary elections are held prior to the general election if more than two candidates file to run per seat on the ballot.[5]
To get on the ballot, school committee candidates had to file with the city by August 15, 2017.[6] The candidate withdrawal deadline was September 1, 2017.[2]
To vote in the election, citizens of the school district had to register by October 18, 2017.[7] Photo identification was not required to vote in Massachusetts.[8]
Candidates and results
At-large
Results
| New Bedford Public Schools, At-large General Election, 4-year terms, 2017 |
||
|---|---|---|
| Candidate | Vote % | Votes |
| 31.41% | 7,942 | |
| 25.86% | 6,539 | |
| 22.45% | 5,675 | |
| Rich Porter | 20.07% | 5,075 |
| Write-in votes | 0.21% | 53 |
| Total Votes | 25,284 | |
| Source: City of New Bedford, "Summary Report," accessed November 28, 2017 | ||
Candidates
| Josh Amaral |
Colleen Dawicki | ||
|---|---|---|---|
|
|||
| John Oliveira |
Rich Porter | ||
Additional elections on the ballot
- See also: Massachusetts elections, 2017
The New Bedford School Committee election shared the ballot with elections for New Bedford mayor, assessor, and city council.[9]
Key deadlines
The following dates were key deadlines for the New Bedford School Committee election.[2][7]
Endorsements
Do you know of an official or organization that endorsed a candidate in this race? Let Ballotpedia know by email at editor@ballotpedia.org.
Campaign finance
The New Bedford Election Commission does not publish and freely disclose school board candidate campaign finance reports. If you have any information regarding the campaign finance disclosures in this race, please contact the school board elections team at editor@ballotpedia.org.
Reporting requirements
New Bedford School Committee candidates had to file two campaign finance reports. The first report was due October 30, 2017, and the second report was due January 22, 2018.[10]
Past elections
To see results from past elections in New Bedford Public Schools, click here.
What was at stake?
Report a story for this election
Ballotpedia researches issues in school board elections across the United States, but information availability is a challenge for us in many school districts. Please contact us about the issues that impact your local school district. Note that not all submissions may meet Ballotpedia's coverage requirements for inclusion.
Election trends
- See also: School boards in session: 2015 in brief
The 2017 election attracted fewer candidates than the district's 2013 and 2015 elections attracted. In 2017, four candidates filed to run for three seats for an average of 1.33 candidates per seat, while in both 2013 and 2015 an average of two candidates filed to run per seat.
The 2017 election was guaranteed to elect two newcomers to the board due to open seats. One newcomer was elected to the board in both 2013 and 2015. Both newcomers won open seats.
| School board election trends | ||||||
|---|---|---|---|---|---|---|
| Year | Candidates per seat | Unopposed seats | Incumbents running for re-election | Incumbent success rate | Seats won by newcomers | |
| New Bedford Public Schools | ||||||
| 2017 | 1.33 | 0.00% | 33.33% | 100.00% | 66.67% | |
| 2015 | 2.00 | 0.00% | 66.67% | 100.00% | 33.33% | |
| 2013 | 2.00 | 25.00% | 75.00% | 100.00% | 25.00% | |
| Massachusetts | ||||||
| 2015 | 1.49 | 25.49% | 68.63% | 85.71% | 33.33% | |
| United States | ||||||
| 2015 | 1.72 | 35.95% | 70.37% | 82.66% | 40.81% | |
Candidate survey
|
Ballotpedia invites school board candidates to participate in its annual survey. |
About the district
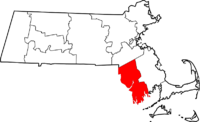
The New Bedford school district is located in southeast Massachusetts in Bristol County. The county seat is Taunton. The county was home to an estimated 558,324 residents in 2016, according to the United States Census Bureau.[11] The district was the ninth-largest school district in the state in the 2014-2015 school year and served 12,565 students.[12]
Demographics
Bristol County underperformed compared to Massachusetts as a whole in terms of higher education achievement between 2011 and 2015. The United States Census Bureau found that 25.9 percent of county residents aged 25 years and older had attained a bachelor's degree, compared to 40.5 percent of state residents. During the same time period, the median household income in Bristol County was $56,842, compared to $68,563 for the entire state. The poverty rate was 12.6 percent, while it was 11.5 percent statewide.[11]
| Racial Demographics, 2016[11] | ||
|---|---|---|
| Race | Bristol County (%) | Massachusetts (%) |
| White | 89.7 | 81.8 |
| Black or African American | 5.1 | 8.6 |
| American Indian and Alaska Native | 0.6 | 0.5 |
| Asian | 2.3 | 6.7 |
| Native Hawaiian and Other Pacific Islander | 0.1 | 0.1 |
| Two or More Races | 2.2 | 2.3 |
| Hispanic or Latino | 7.6 | 11.5 |
Note: Percentages for race and ethnicity may add up to more than 100 percent because respondents may report more than one race and the Hispanic/Latino ethnicity may be selected in conjunction with any race. Read more about race and ethnicity in the census here.
Recent news
The link below is to the most recent stories in a Google news search for the terms New Bedford Public Schools Massachusetts election. These results are automatically generated from Google. Ballotpedia does not curate or endorse these articles.
See also
| New Bedford Public Schools | Massachusetts | School Boards |
|---|---|---|
|
External links
Footnotes
- ↑ 1.0 1.1 New Bedford Public Schools, "School Committee," accessed August 14, 2017
- ↑ 2.0 2.1 2.2 South Coast Today, "Nomination paper deadline sets scene for New Bedford elections," August 15, 2017
- ↑ New Bedford Election Commission, "2017 Preliminary Election Candidates," accessed September 5, 2017
- ↑ New Bedford Guide, "New Bedford Election Results – 7 November, 2017," November 7, 2017
- ↑ NewBedfordGuide.com, "Four File Officially for Three New Bedford School Committee Seats," September 1, 2017
- ↑ New Bedford Election Commission, "Calendar," accessed August 14, 2017
- ↑ 7.0 7.1 Secretary of the Commonwealth of Massachusetts, "Registering to Vote," accessed August 9, 2017
- ↑ Massachusetts Secretary of the Commonwealth, "Identification Requirements," accessed June 28, 2017
- ↑ New Bedford Election Commission, "Nomination papers available for 2017 municipal election," May 19, 2017
- ↑ Office of Campaign and Political Finance Commonwealth of Massachusetts, "Campaign Finance Guide Candidates for Municipal Office (Non-Depository)," accessed September 11, 2017
- ↑ 11.0 11.1 11.2 United States Census Bureau, "QuickFacts: Bristol County, Massachusetts; Massachusetts," accessed August 9, 2017
- ↑ U.S. Department of Education, National Center for Education Statistics, "Common Core of Data, file ccd_lea_052_1414_w_0216161a, 2014-2015," accessed November 16, 2016
| New Bedford Public Schools elections in 2017 | |
| Bristol County, Massachusetts | |
| Election date: | November 7, 2017 |
| Candidates: | At-large: • Incumbent, Josh Amaral • Colleen Dawicki • John Oliveira • Rich Porter |
| Important information: | What's at stake? • Additional elections on the ballot • Key deadlines |


