Scott Rasmussen's Number of the Day for March 8, 2022
The Number of the Day columns published on Ballotpedia reflect the views of the author.
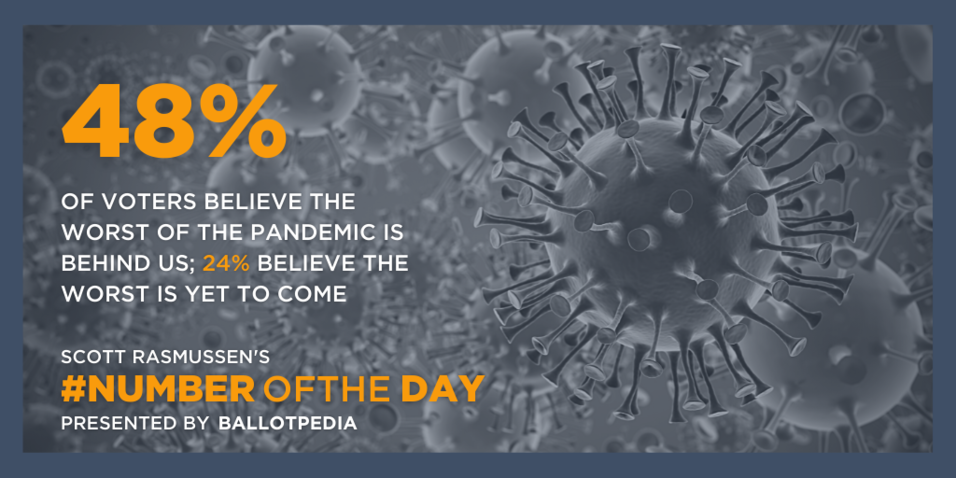
March 8, 2022: Forty-eight percent (48%) of voters now believe the worst of the pandemic is behind us. That’s up eight points over the past three weeks. A Scott Rasmussen national survey found that 24% believe the worst is yet to come. That figure is down eight points from mid-February.
Combined, these figures represent the most optimistic assessment since May, 2021. At the end of that month, 56% believed the worst was behind us.
Among senior citizens, 55% say the worst is behind us while 15% fear it is still to come. However, voters under 35 are evenly divided. Looking ahead, the survey found that 53% are more worried about government lockdowns and restrictions than they are about getting COVID. Thirty-six percent (36%) are more worried about getting COVID.
Most Democrats (60%) are more worried about getting COVID. Most Republicans (71%) and independents (55%) are more worried about government restrictions and lockdowns.
| Worst of Pandemic is Behind Us | Worst of Pandemic is Still to Come | Net | |
|---|---|---|---|
| Mar. 3-5 | 48% | 24% | +24% |
| Feb. 10-13 | 40% | 32% | +8% |
| Jan. 24-25 | 29% | 44% | -15% |
| Jan. 3-4. | 30% | 39% | -9% |
| Dec. 21-22 | 27% | 46% | -19% |
| Dec. 14-15 | 29% | 40% | -11% |
| Dec. 1-3 | 32% | 40% | -8% |
| Nov. 22-23 | 40% | 37% | +3% |
| Nov. 15-16 | 43% | 34% | +9% |
| Nov. 8-11 | 46% | 28% | +18% |
| Nov. 4-7 | 44% | 29% | +15% |
| Oct. 28-30 | 40% | 30% | +10% |
| Oct. 11-13 | 38% | 34% | +4% |
| Sept. 30-Oct. 2 | 28% | 42% | -14% |
| Sept. 14-15 | 28% | 45% | -17% |
| Aug. 20-22 | 25% | 48% | -23% |
| Aug. 5-7 | 29% | 43% | -14% |
| July 29-31 | 28% | 45% | -17% |
| July 22-24 | 34% | 38% | -4% |
| July 15-17 | 37% | 33% | +4% |
| May 27-29 | 56% | 20% | +36% |
| May 20-22 | 52% | 21% | +31% |
| Apr. 29-May 1 | 50% | 24% | +26% |
| Apr. 15-17 | 41% | 32% | +9% |
| Mar. 4-6 | 42% | 28% | +14% |
| Feb. 18-20 | 39% | 31% | +8% |
| Jan. 28-30 | 33% | 40% | -7% |
| Dec. 10-12 | 21% | 62% | -41% |
| Nov. 27-28 | 18% | 68% | -50% |
| Nov. 12-14 | 22% | 62% | -40% |
| Oct. 15-17 | 22% | 56% | -34% |
| Oct. 8-10 | 27% | 52% | -25% |
| Oct. 1-3 | 24% | 55% | -31% |
| Sept. 3-5 | 29% | 49% | -20% |
| Aug. 13-15 | 20% | 59% | -39% |
| July 23-25 | 15% | 63% | -48% |
| June 4-6 | 29% | 42% | -13% |
| April 9-11 | 16% | 60% | -44% |
Methodology
The survey of 1,200 registered voters was conducted online by Scott Rasmussen on March 3-5, 2022. Fieldwork for the survey was conducted by RMG Research, Inc. Certain quotas were applied, and the sample was lightly weighted by geography, gender, age, race, education, internet usage, and political party to reasonably reflect the nation’s population of registered voters. Other variables were reviewed to ensure that the final sample is representative of that population.
Note: Neither Scott Rasmussen, ScottRasmussen.com, nor RMG Research, Inc. have any affiliation with Rasmussen Reports. While Scott Rasmussen founded that firm, he left nearly a decade ago and has had no involvement since that time.
Each weekday, Scott Rasmussen’s Number of the Day explores interesting and newsworthy topics at the intersection of culture, politics, and technology.
- March 7, 2022-68 percent of voters want U.S. to side with Ukraine, 5% say Russia, 15% neither
- March 4, 2022-53 percent of voters believe America’s legal system cares more about criminals than victims
- March 3, 2022-23 percent of voters believe defunding the police will lead to less crime
- March 2, 2022-67 percent of voters believe biological males who identify as women have an unfair advantage in women’s sport
- March 1, 2022-56 percent of voters think the U.S. will still be world’s leading superpower in 20 years
- To see other recent numbers, check out the archive.
Scott Rasmussen’s Number of the Day is published by Ballotpedia weekdays at 8:00 a.m. Eastern. Click here to check out the latest update.
The Number of the Day is broadcast on local stations across the country. An archive of these broadcasts can be found here.
Columns published on Ballotpedia reflect the views of the author.
Ballotpedia is the nonprofit, nonpartisan Encyclopedia of American Politics.
See also
Footnotes


