Scott Rasmussen's Number of the Day for May 22, 2017
The Number of the Day columns published on Ballotpedia reflect the views of the author.
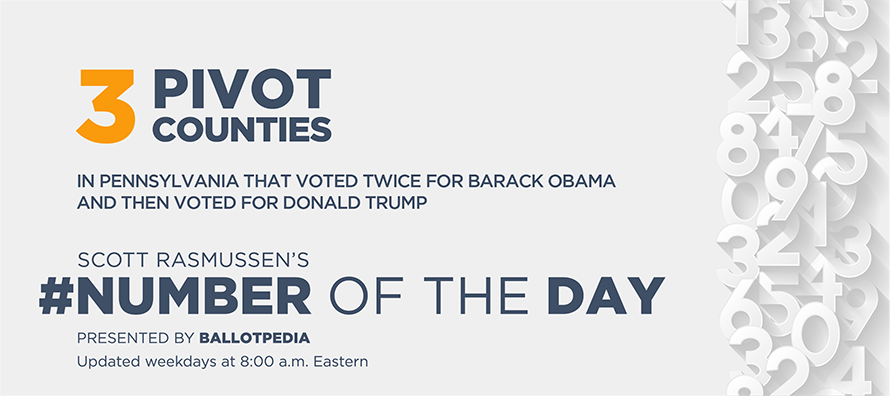
May 22, 2017: Pennsylvania is home to three of the nation’s 206 Pivot Counties. These are counties that voted twice for Barack Obama and then voted for Donald Trump. Both in Pennsylvania and nationwide, these counties had an outsized impact on the election outcome. From now until Election 2018, Ballotpedia will regularly release new data on these counties and explore what they can teach us about national trends. Last week, the most recent report detailed demographic data for the Pivot Counties.
The Pennsylvania Pivot Counties are Erie County, Luzerne County, and Northampton County. Earlier looks at the Pivot Counties showed that they were especially important in delivering Iowa and Michigan to Trump. In Pennsylvania, however, it turns out that increased margins in solidly Republican counties played a bigger role. Forty-nine of the nation’s 2,226 solidly Republican counties are found in the Keystone State.
Statewide, Trump’s 2016 campaign outperformed Mitt Romney’s 2012 effort by 354,132 votes (Romney lost by 309,840 votes; Trump won by 44,292 votes). As shown in the table below, the solidly Republican counties provided 78 percent of those gains. That’s partly because 2016 turnout was higher in these counties by almost 200,000 votes. Additionally, Trump carried these counties by 34 percentage points (65 percent to 31 percent). Four years earlier, Romney’s margin was only 23 points (61 percent to 38 percent). Pivot Counties provided 18 percent of the GOP improvement. That’s still pretty remarkable given that they cast only 7 percent of the vote.
| Pennsylvania counties | Net vote change from 2012 to 2016 | % of net votes gained by GOP in 2016 | % of total votes cast in 2016 |
|---|---|---|---|
| Pivot | 64,811 | 18.3% | 6.6% |
| Solid GOP | 277,076 | 78.2% | 35.7% |
| Solid Dem | -2,572 | -0.7% | 48.6% |
| Other | 14,817 | 4.2% | 9.1% |
| Total | 354,132 | 100.0% | 100.0% |
Obama won the Pennsylvania Pivot Counties by 14 percentage points in 2008 and by 9 points in 2012. However, in 2016, Trump won these counties by 8 points.
| Pennsylvania counties | 2016 | 2012 | 2008 |
|---|---|---|---|
| Republican | 52% | 45% | 42.0% |
| Democrat | 44% | 54% | 56.0% |
| Margin | R+8 | D+9 | D+14 |
Statewide, Obama won Pennsylvania by 10 percentage points in 2008 and by 5 points in 2012. In 2016, Trump won by less than a percentage point. In other words, in 2008 and 2012, the Pivot Counties were more supportive of the Democratic candidate than the rest of the state. But in 2016, those same counties were more supportive of the Republican than the rest of the state.
The table below shows the Republican margins contributed by each type of county in the last three presidential elections.
| Pennsylvania counties | 2016 | 2012 | 2008 |
|---|---|---|---|
| Pivot | 33,658 | -31,153 | -53,493 |
| Solid GOP | 742,264 | 465,188 | 317,918 |
| Solid Dem | -763,621 | -761,049 | -843,380 |
| Always wrong | 0 | 0 | 0 |
| Other | 31,991 | 17,174 | -41,523 |
| Total | 44,292 | -309,840 | -620,478 |
The map below highlights the different types of counties in Pennsylvania.
- May 19, 2017 50.8 percent of American homes do not have landlines
- May 18, 2017 9 apps used per day by smartphone users
- May 17, 2017 44 years ago today: Senate Watergate hearings began
- May 16, 2017 21 years old: Age when most Americans think people should be financially independent of their parents
- May 15, 2017 12 Pivot Counties in Michigan that voted twice for Barack Obama and then for Donald Trump
- To see other recent numbers, check out the archive.
Scott Rasmussen’s Number of the Day is published by Ballotpedia weekdays at 8:00 a.m. Eastern. Click here to check out the latest update.
The Number of the Day is broadcast on local stations across the country. An archive of these broadcasts can be found here.
Columns published on Ballotpedia reflect the views of the author.
Ballotpedia is the nonprofit, nonpartisan Encyclopedia of American Politics.
See also
| |||||||||||||||||||||||


