Scott Rasmussen's Number of the Day for May 30, 2017
The Number of the Day columns published on Ballotpedia reflect the views of the author.
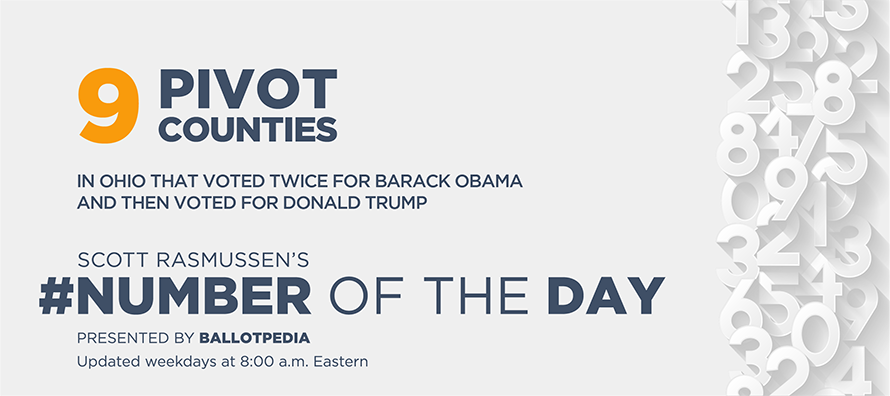
May 30, 2017: Ohio is home to nine of the nation's 206 Pivot Counties. These are counties that voted twice for Barack Obama and then voted for Donald Trump. In many states, these counties had an outsized impact on the election outcome. From now until Election 2018, Ballotpedia will regularly release new data on these counties and explore what they can teach us about national trends.
Pivot Counties were especially important in delivering Iowa and Michigan to Trump. In Pennsylvania, however, increased margins in solidly Republican counties played a bigger role. Although the impact wasn’t quite as dramatic, that was generally also true in Ohio as well where 66 of the nation’s 2,226 solidly Republican counties are found.
Statewide, Mitt Romney’s 2012 campaign lost Ohio by a margin of 51 percent to 48 percent. Last year, Trump carried the Buckeye state by eight points, 51 percent to 43 percent. In raw vote totals, Romney lost by 166,272 votes and Trump won the state by 446,841 votes. In other words, Trump’s 2016 campaign outperformed Mitt Romney’s 2012 effort by 613,113.
Just over half of those statewide gains (52 percent) came from solidly Republican counties. Those counties gave Romney a 22-point margin in 2012 (60 percent to 38 percent). But Trump generated a much higher degree of enthusiasm and carried those GOP counties by 37 points (66 percent to 29 percent).
Twenty-one percent of the GOP gains in Ohio came from Pivot Counties.
Interestingly, 19 percent of the gains came from solidly Democratic counties. In 2012, Obama carried those counties by 588,547 votes. In 2016, Hillary Clinton won those same counties by just 474,258 votes.
The Ohio Pivot Counties are Ashtabula, Erie, Montgomery, Ottawa, Portage, Sandusky, Stark, Trumbull, and Wood.
| Ohio counties | Net vote change from 2012 to 2016 | % of net votes gained by GOP in 2016 | % of total votes cast in 2016 |
|---|---|---|---|
| Pivot | 128,934 | 21.00% | 14.50% |
| Solid GOP | 319,994 | 52.20% | 38.90% |
| Solid Dem | 114,289 | 18.60% | 42.50% |
| Other | 49,896 | 8.10% | 4.10% |
| Total | 613,113 | 100.00% | 100.00% |
Obama won the Ohio Pivot Counties by 14 percentage points in 2008 and by 9 points in 2012. However, in 2016, Trump won these counties by 8 points.
| Ohio counties | 2016 | 2012 | 2008 |
|---|---|---|---|
| Republican | 52% | 46.00% | 45.00% |
| Democrat | 43% | 53.00% | 54.00% |
| Margin | R+8 | D+7 | D+9 |
The table below shows the Republican margins contributed by each type of county in the last three presidential elections.
| Ohio counties | 2016 | 2012 | 2008 |
|---|---|---|---|
| Pivot | 72,986 | -55,948 | -77,861 |
| Solid GOP | 788,554 | 468,560 | 411,499 |
| Solid Dem | -474,258 | -588,547 | -592,210 |
| Other | 59,559 | 9,663 | -3,652 |
| Total | 446,841 | -166,272 | -262,224 |
The map below highlights the different types of counties in Ohio.
- May 29, 2017 1,196,793 military men and women who gave their life for our freedom
- May 26, 2017 36 hospitals across 10 states owned by Steward Health Care System
- May 25, 2017 5 steps we can all take to create a bright future for our nation
- May 24, 2017 17 percent of newlyweds marry across racial & ethnic lines
- May 23, 2017 27 million foreign-born workers in the U.S. workforce
- To see other recent numbers, check out the archive.
Scott Rasmussen’s Number of the Day is published by Ballotpedia weekdays at 8:00 a.m. Eastern. Click here to check out the latest update.
The Number of the Day is broadcast on local stations across the country. An archive of these broadcasts can be found here.
Columns published on Ballotpedia reflect the views of the author.
Ballotpedia is the nonprofit, nonpartisan Encyclopedia of American Politics.
See also
- Scott Rasmussen's Number of the Day
- Pivot Counties: The counties that voted Obama-Obama-Trump from 2008-2016
- Ohio
- Presidential election in Ohio, 2016
Footnotes
| |||||||||||||||||||||||


