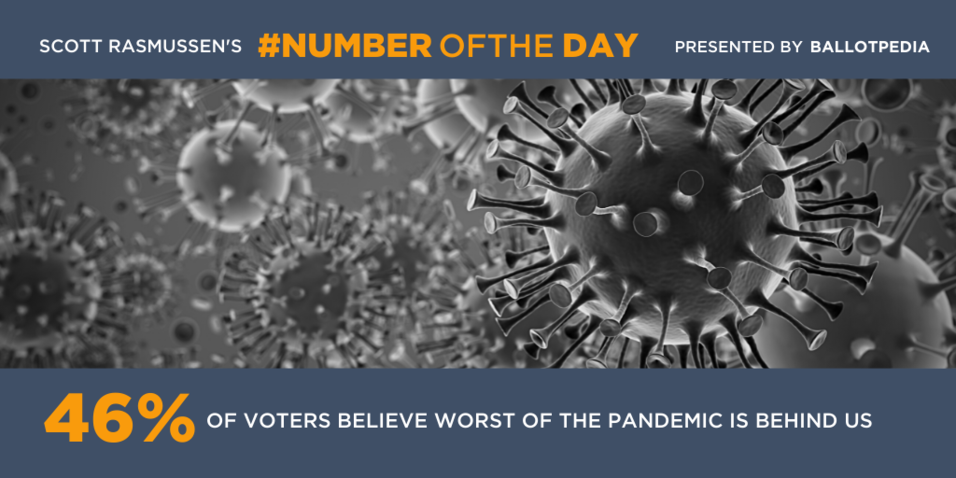
Scott Rasmussen's Number of the Day for November 17, 2021
The Number of the Day columns published on Ballotpedia reflect the views of the author.
November 17, 2021: Forty-six percent (46%) of voters now believe the worst of the pandemic is behind us. That’s up six points since the end of October and up 18 points since the end of September. A Scott Rasmussen national survey found that 28% believe the worst is still to come and 26% are not sure.[1]
This is the most optimistic assessment since May.[1]
Confidence about the pandemic grew dramatically earlier in the year as vaccines became available. By May, 56% of voters said the worst was behind us. With the arrival of the Delta variant, confidence fell. By late August, 25% believed the worst was behind us. At that point, nearly twice as many (48%) believed the worst was still to come.[1]
When October arrived, confidence once again began to grow. By the end of October, 75% of voters were close to resuming their normal life in terms of going out socially, traveling, and interacting with others in person.[1]
Among those who don’t believe the worst is behind us, only half (51%) are worried about ongoing health issues. Thirty-six percent (36%) are worried about more government restrictions and mandates.[2]
| Worst of Pandemic is Behind Us | Worst of Pandemic is Still to Come | Net | |
|---|---|---|---|
| Nov. 4-7 | 44% | 29% | +15% |
| Oct. 28-30 | 40% | 30% | +10% |
| Oct. 11-13 | 38% | 34% | +4% |
| Sept. 30-Oct. 2 | 28% | 42% | -14% |
| Sept. 14-15 | 28% | 45% | -17% |
| Aug. 20-22 | 25% | 48% | -23% |
| Aug. 5-7 | 29% | 43% | -14% |
| July 29-31 | 28% | 45% | -17% |
| July 22-24 | 34% | 38% | -4% |
| July 15-17 | 37% | 33% | +4% |
| May 27-29 | 56% | 20% | +36% |
| May 20-22 | 52% | 21% | +31% |
| Apr. 29-May 1 | 50% | 24% | +26% |
| Apr. 15-17 | 41% | 32% | +9% |
| Mar. 4-6 | 42% | 28% | +14% |
| Feb. 18-20 | 39% | 31% | +8% |
| Jan. 28-30 | 33% | 40% | -7% |
| Dec. 10-12 | 21% | 62% | -41% |
| Nov. 27-28 | 18% | 68% | -50% |
| Nov. 12-14 | 22% | 62% | -40% |
| Oct. 15-17 | 22% | 56% | -34% |
| Oct. 8-10 | 27% | 52% | -25% |
| Oct. 1-3 | 24% | 55% | -31% |
| Sept. 3-5 | 29% | 49% | -20% |
| Aug. 13-15 | 20% | 59% | -39% |
| July 23-25 | 15% | 63% | -48% |
| June 4-6 | 29% | 42% | -13% |
| April 9-11 | 16% | 60% | -44% |
Each weekday, Scott Rasmussen’s Number of the Day explores interesting and newsworthy topics at the intersection of culture, politics, and technology.
- November 16, 2021 -60 percent of voters oppose payments to individuals without documentation separated at border
- November 15, 2021 -68 percent of voters believe people residing in the country without legal permission increase federal spending and deficits
- November 12, 2021 -84 percent of voters want everyone entering U.S. tested for COVID and other health issues
- November 10, 2021 -71 percent of voters expect they would recover quickly from COVID-19 with minor symptoms
- November 9, 2021 -84 percent of voters consider asylum seekers who don’t return for court hearings to be a serious problem
- To see other recent numbers, check out the archive.
Scott Rasmussen’s Number of the Day is published by Ballotpedia weekdays at 8:00 a.m. Eastern. Click here to check out the latest update.
The Number of the Day is broadcast on local stations across the country. An archive of these broadcasts can be found here.
Columns published on Ballotpedia reflect the views of the author.
Ballotpedia is the nonprofit, nonpartisan Encyclopedia of American Politics.
See also
- Scott Rasmussen's Number of the Day
- Documenting America's Path to Recovery
- Scott Rasmussen's Number of the Day for November 8, 2021
Footnotes


