Category:Who runs the states project, images, part three
From Ballotpedia
Subcategories
This category has the following 2 subcategories, out of 2 total.
Media in category "Who runs the states project, images, part three"
The following 67 files are in this category, out of 67 total.
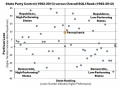
 Alabama scatter plot who runs the states.jpg 706 × 513; 53 KB
 Alaska scatter plot who runs the states.jpg 708 × 513; 52 KB
 Arizona scatter plot who runs the states.jpg 708 × 513; 52 KB
 Arkansas scatter plot who runs the states.jpg 708 × 514; 53 KB
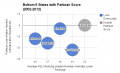 Bottom 5 States with Partisan Score Bubble Chart, 02-12.png 565 × 345; 24 KB
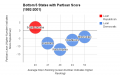 Bottom 5 States with Partisan Score Bubble Chart, 92-01.png 570 × 367; 26 KB
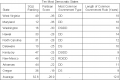
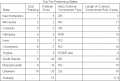
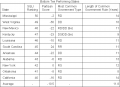 Bottom ten performing states table.png 672 × 486; 19 KB
 California scatter plot who runs the states.jpg 706 × 513; 54 KB
 Colorado scatter plot who runs the states.jpg 708 × 514; 52 KB
 Connecticut scatter plot who runs the states.jpg 708 × 514; 53 KB
 Delaware scatter plot who runs the states.jpg 706 × 512; 53 KB
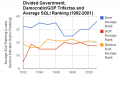
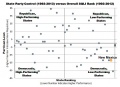
 Dem, GOP, Divided and SQLI 02-12.png 450 × 320; 18 KB
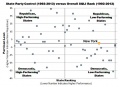
 Dem, GOP, Divided and SQLI 92-01.png 450 × 320; 17 KB
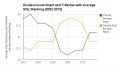
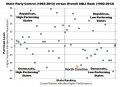
 Dem, GOP, Divided SQLI 92-12.png 450 × 320; 20 KB
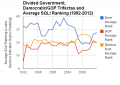
 Divided, Trifectas SQLI 02-12.png 600 × 371; 20 KB
 Florida scatter plot who runs the states.jpg 707 × 513; 52 KB
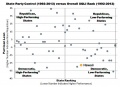
 Georgia scatter plot who runs the states.jpg 707 × 515; 52 KB
 Hawaii scatter plot who runs the states.jpg 707 × 513; 52 KB
 Idaho scatter plot who runs the states.jpg 708 × 514; 52 KB
 Illinois scatter plot who runs the states.jpg 707 × 514; 52 KB
 Indiana scatter plot who runs the states.jpg 708 × 514; 52 KB
 Iowa scatter plot who runs the states.jpg 703 × 509; 52 KB
 Kansas scatter plot who runs the states.jpg 708 × 514; 52 KB
 Kentucky scatter plot who runs the states.jpg 707 × 513; 53 KB
 Louisiana scatter plot who runs the states.jpg 706 × 513; 53 KB
 Maine scatter plot who runs the states.jpg 708 × 514; 52 KB
 Maryland scatter plot who runs the states.jpg 707 × 513; 53 KB
 Massachusetts scatter plot who runs the states.jpg 706 × 511; 54 KB
 Michigan scatter plot who runs the states.jpg 708 × 512; 52 KB
 Minnesota scatter plot who runs the states.jpg 708 × 514; 52 KB
 Mississippi scatter plot who runs the states.jpg 708 × 514; 52 KB
 Missouri scatter plot who runs the states.jpg 708 × 513; 53 KB
 Montana scatter plot who runs the states.jpg 707 × 514; 52 KB
 Nebraska scatter plot who runs the states.jpg 707 × 513; 53 KB
 Nevada scatter plot who runs the states.jpg 708 × 513; 52 KB
 New Hampshire scatter plot who runs the states.jpg 709 × 514; 53 KB
 New Jersey scatter plot who runs the states.jpg 707 × 514; 52 KB
 New Mexico scatter plot who runs the states.jpg 709 × 515; 53 KB
 New York scatter plot who runs the states.jpg 708 × 514; 52 KB
 North Carolina scatter plot who runs the states.jpg 708 × 514; 53 KB
 North Dakota scatter plot who runs the states.jpg 706 × 512; 53 KB
 Ohio scatter plot who runs the states.jpg 706 × 513; 53 KB
 Oklahoma scatter plot who runs the states.jpg 707 × 514; 52 KB
 Oregon scatter plot who runs the states.jpg 708 × 513; 52 KB
 Pennsylvania scatter plot who runs the states.jpg 624 × 452; 44 KB
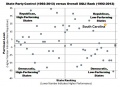
 Rhode Island scatter plot who runs the states.jpg 707 × 513; 53 KB
 South Carolina scatter plot who runs the states.jpg 707 × 514; 53 KB
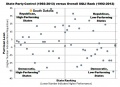 South Dakota scatter plot who runs the states.jpg 707 × 513; 52 KB
 State Avg Rankings During Dem Trifecta.png 715 × 351; 54 KB
 State Avg Rankings During GOP Trifecta years.png 723 × 345; 54 KB
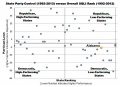
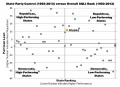
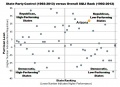
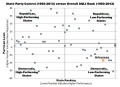
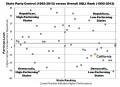
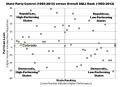
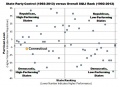
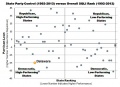
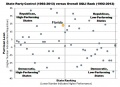
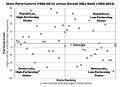
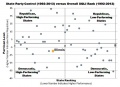
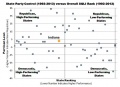
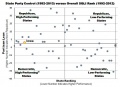
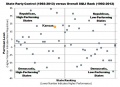
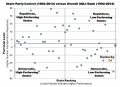
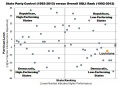
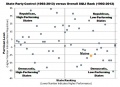
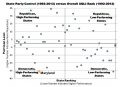
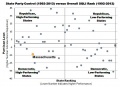
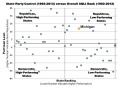
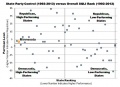
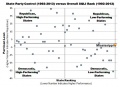
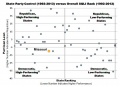
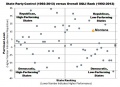
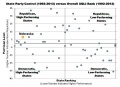
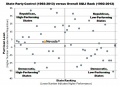
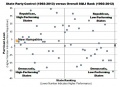
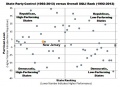
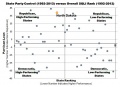
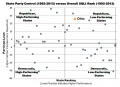
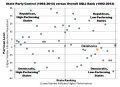
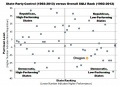
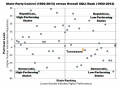
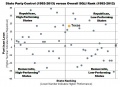
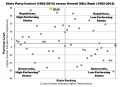
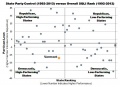
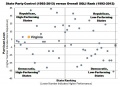
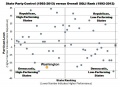
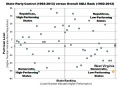
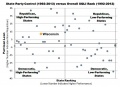
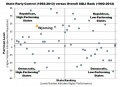
 State party control versus overall SQLI rank.png 624 × 453; 90 KB
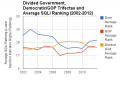
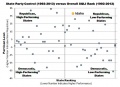
 State performance related to trifecta government.png 780 × 324; 23 KB
 Ten most Democratic states table.png 676 × 452; 18 KB
 Ten most politically split states table.png 676 × 487; 18 KB
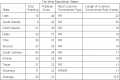 Ten most Republican states table.png 676 × 452; 17 KB
 Tennessee scatter plot who runs the states.jpg 707 × 513; 53 KB
 Texas scatter plot who runs the states.jpg 702 × 509; 53 KB
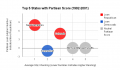 Top 5 States by Partisan Score Bubble Chart, 92-01.png 609 × 353; 24 KB
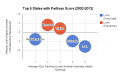 Top 5 States with Partisan Score Bubble Chart, 02-12.png 575 × 349; 25 KB
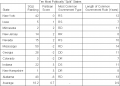
 Top ten performing states table.png 676 × 455; 17 KB
 Utah scatter plot who runs the states.jpg 705 × 512; 53 KB
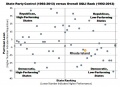
 Vermont scatter plot who runs the states.jpg 706 × 513; 53 KB
 Virginia scatter plot who runs the states.jpg 705 × 512; 53 KB
 Washington scatter plot who runs the states.jpg 705 × 513; 54 KB
 West Virginia scatter plot who runs the states.jpg 708 × 512; 53 KB
 Wisconsin scatter plot who runs the states.jpg 707 × 513; 52 KB
 Wyoming scatter plot who runs the states.jpg 708 × 514; 52 KB


