File:Frequencypartisancompositionbargraph.png
From Ballotpedia
Size of this preview: 800 × 581 pixels. Other resolution: 1,424 × 1,035 pixels.
Original file (1,424 × 1,035 pixels, file size: 604 KB, MIME type: image/png)
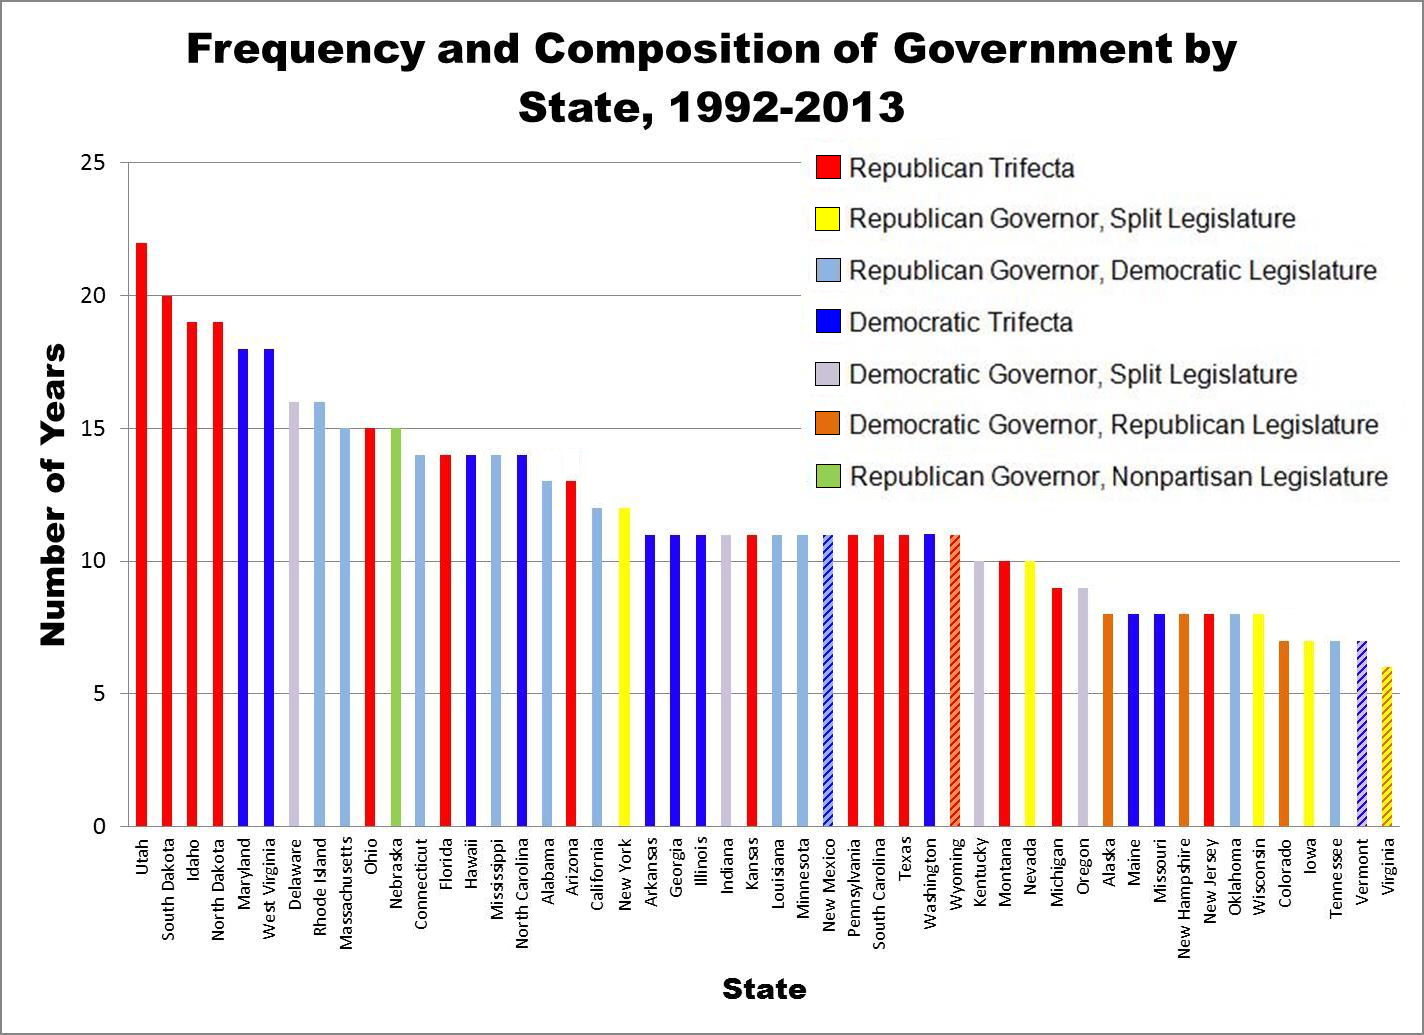
A bar graph showing the most frequent partisan status of each state's government and for how many years it had that status from 1992 to 2013.
you can send your inquiry to editor@ballotpedia.org |
File history
Click on a date/time to view the file as it appeared at that time.
| Date/Time | Thumbnail | Dimensions | User | Comment | |
|---|---|---|---|---|---|
| current | 05:42, 21 May 2013 | | 1,424 × 1,035 (604 KB) | Andymarshall (contribs) | Breakdown of the most common composition of government by state, 1992-2013 Category:Who runs the states project, images {{BP logo}} |
You cannot overwrite this file.
File usage
The following page uses this file: