Midland Independent School District staff (1992-2012)
In 2013, the Midland Independent School District was the largest employer in the city of Midland.[1] From 1992 to 2012, the district saw a 64.71 percent increase in its total staff and averaged 2,652.74 staff members per year. The range ran from a low of 1,622.00 employees in 1992 to a high of 2,835.40 employees in 2002.
These staff increases were not seen equally across all areas.[2] The graph above shows the overall changes in the number of staff according to the following categories: teachers, instructional aids and coordinators, guidance counselors, library staff (librarians, media specialists and support staff), administrators (LEA and school) and support staff (general, student and other).
The data on this page regarding the number of staff in various positions in Midland ISD were gathered from the National Center for Education Statistics (NCES). Data are not available for all categories in every year. The date range for each set of data is noted in the sections below. The full data set from the NCES examined on this page can be viewed in the data tables at the bottom of this page.
Teachers
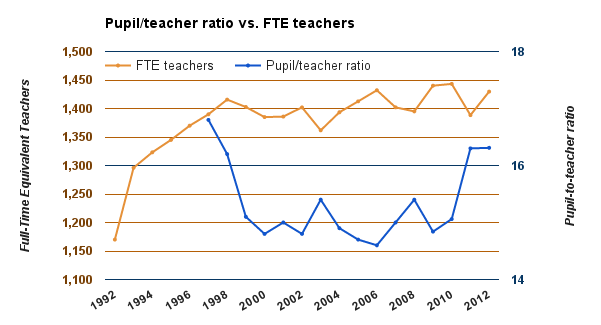
The National Center for Education Statistics (NCES) provides data on the full-time equivalent (FTE) teachers dating back to 1992. Raw personnel numbers for teachers by type are also available for that time period, except for pre-kindergarten and ungraded teachers. NCES data for those groups goes back to 1997. Overall, the district's number of FTE teachers increased by 2.87 percent from 1992 to 2012. The pupil-teacher ratio fell by 2.92 percent from 1997 to 2012.[2]
The average number of FTE teachers in the district from 1992 to 2012 was 1,380.11, ranging from a minimum of 1,170.00 teachers in 1992 to a maximum of 1,443.14 in 2010. The levels of employment have varied across teacher types during these two decades.[2]
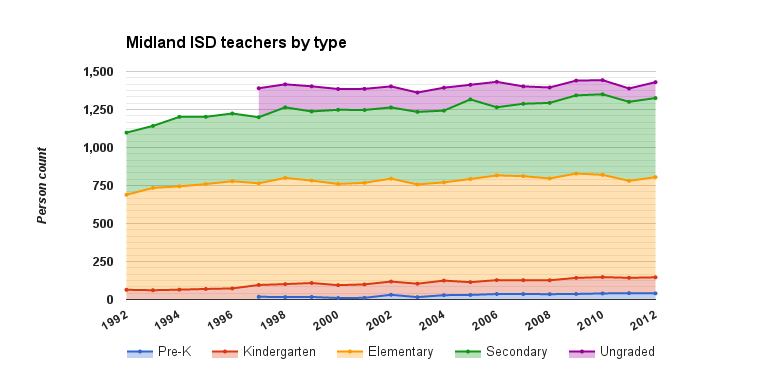
The raw number of personnel employed as pre-kindergarten, kindergarten and secondary teachers increased over the time span, while the number of elementary and ungraded teachers decreased. Each category had the following minimum, maximum and average number of personnel from 1992 to 2012 (except for pre-kindergarten and ungraded, which run from 1997 to 2012):[2]
|
Pre-kindergarten
|
Kindergarten
|
Elementary
|
Secondary
|
Ungraded
|
Salaries
The base annual salary for teachers in Midland ISD in the 2013-2014 school year was $47,000. Collective bargaining for educators is against the law in Texas, meaning that the salary schedule is set without a negotiation between the district and a teacher's union.
Signing bonuses
In May 2014, Midland ISD announced that 325 signing bonuses to new district teachers would be given for the 2014-2015 school year. The bonuses were worth $10,000 over three years for employees committing to the district for that time span. In addition, the district provided 1,200 re-signing bonuses worth $2,500 to current teachers who signed on for the 2014-2015 school year. The bonuses came as a result of a charitable donation totaling $6.25 million by five businesses and three charitable foundations.
The Midland Reporter-Telegram reported that as a result of the new bonuses, new district teachers could out-earn their co-workers. The 2013-2014 salary schedule showed first-year teachers earning $47,000 annually. With a $200 raise given in the second year of teaching and the $2,500 re-signing bonus, new hires would make $49,700. For the 2014-2015 school year, new teachers would earn $50,333—which includes one-third of the $10,000 bonus—in their first year. According to Superintendent Ryder Warren, the teachers were satisfied with the bonus system:
| “ | I actually polled a group of about 20 teachers that I consider my teacher leaders of the school district, and asked them the same thing — because the morale issue is a huge thing — about the difference between the $2,500 and the $3,300 for three years. They said two things. The group of teachers said, No. 1, $2,500 would be very much appreciated by everyone, because it wouldn’t have been there had these people not stepped up.
Second of all, they understand we’ve got to have more help in the schools. We’ve got to get new blood; we’ve got to get new help. We’ve got teachers who are doing double-duties; we’ve got teachers who are filling in. We’ve got to have more help.[3] |
” |
| —Superintendent Warren, Midland Reporter-Telegram (2014) | ||
Instructional aides and coordinators
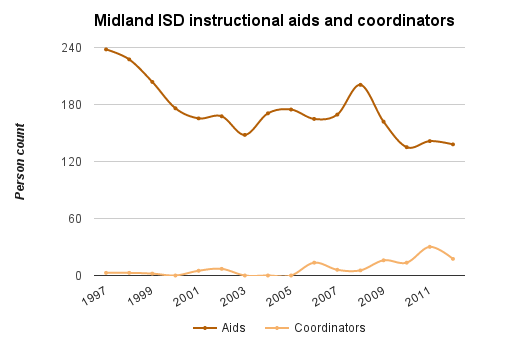
The National Center for Education Statistics (NCES) provides data on the raw number of district staff working as instructional aides and coordinators dating back to 1997. From 1997 to 2012, the district overall decreased the number of instructional aides it employed. Meanwhile, instructional coordinators saw a small rise.[2]
During this time period, the district employed an average of 174 instructional aides. The largest number of aides employed during that period was 238 in the 1997-1998 school year. The minimum was 135 in 2010. Overall, the number of instructional aides employed by the district decreased by 42 percent from 1997 to 2012.[2]
The number of instructional coordinators employed by the district during this time ranged from a low of zero to a high of 30. The average number of coordinators per year was eight coordinators. From 1997 to 2012, the number of coordinators working in the district increased by 525 percent.[2]
Guidance counselors
From 1997 to 2012, Midland ISD employed an average of 49.48 guidance counselors each year. The highest number of guidance counselors employed by the district during that period was 65.5 in 2001. The minimum was 36.4 in 2004. Over this time period, the district increased the total number of guidance counselors by 21.9 percent.[2]
Librarians, media specialists and support staff
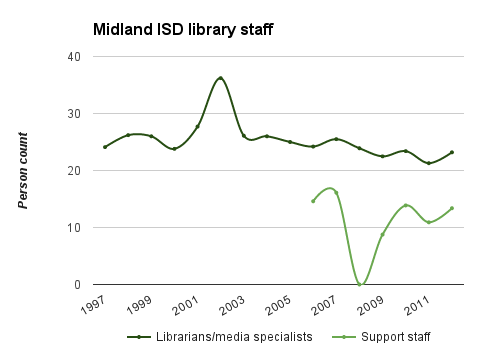
The National Center for Education Statistics (NCES) provides raw person counts for the number of librarians and media specialists dating back to 1997. Data for library support staff is available as far back as 2006.[2]
Overall staffing levels in both categories were relatively unchanged from the earliest data up to 2012. Between 1997 and 2012, the district employed an average of 25 librarians and media specialists. The maximum number during that time was 36 and the minimum was 21 such employees. The total percent change in librarians and media specialists was 4 percent, from 24 in 1997 to 23 in 2012.[2]
Since 2006, the number of support staff for library and media needs ranged widely, from a high of 16 in 2007 to a low of zero in 2008. An average of 11 people were employed as support staff for the library and media services from 2006 to 2012. The total percent change in the number of support staff was 13 percent, from 15 support staff in 2006 to 13 in 2012.[2]
Administrators and support staff
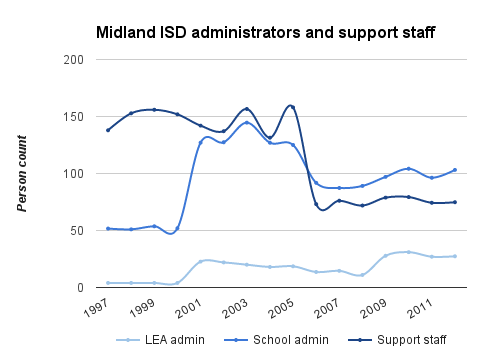
From 1997 to 2012, Midland ISD increased its overall number of administrators while decreasing the number of support staff allocated to administration.[2]
In 1997, the district had 52 school administrators, four Local Education Agency (LEA) administrators and 138 support staff employees. By 2012, the district had 103 school administrators, 27 LEA administrators and 75 support staff employees.[2]
The number of LEA administrators peaked in 2010 at 31 administrators. The overall number of LEA administrators from 1997 to 2012 increased by 575 percent. Meanwhile, the number of school administrators doubled, peaking at 145 in 2003.[2]
The number of administrative support staff was nearly cut in half during this period, undergoing a 46 percent reduction. The minimum number of support staff was 72 in 2008, and the maximum was 158 in 2005.[2]
The number of school administrators and support staff declined between 2005 and 2006. The number of administrators rose again, ending in 2012 near its 16-year average of 95.51 administrators. Support staff, alternatively, remained reduced to around 70 members each year following the shift. From 1997 to 2012, there was an average of 115.75 support staff; the total number for 2012 was 75 support staff.[2]
Full data tables
Staff by type comparison
| Midland ISD staff compared by type[2] | |||||||||
|---|---|---|---|---|---|---|---|---|---|
| School year | Total staff | Teachers | Instructional aides and coordinators | Guidance counselors | Administrators | Support staff | |||
| 1992-93 | 1,622.00 | 1,098.00 | |||||||
| 1993-94 | 2,565.00 | 1,142.00 | |||||||
| 1994-95 | 2,637.90 | 1,201.60 | |||||||
| 1995-96 | 2,692.20 | 1,202.00 | |||||||
| 1996-97 | 2,471.30 | 1,223.70 | |||||||
| 1997-98 | 2,709.40 | 1,389.80 | 240.80 | 44.30 | 55.70 | 940.10 | |||
| 1998-99 | 2,804.30 | 1,415.60 | 230.30 | 58.50 | 55.00 | 1,003.70 | |||
| 1999-00 | 2,792.90 | 1,402.60 | 205.80 | 53.30 | 57.70 | 1,031.50 | |||
| 2000-01 | 2,718.40 | 1,384.90 | 176.00 | 57.60 | 56.00 | 1,007.10 | |||
| 2001-02 | 2,780.20 | 1,385.80 | 170.40 | 65.50 | 149.70 | 966.10 | |||
| 2002-03 | 2,835.40 | 1,402.00 | 174.60 | 62.50 | 149.40 | 995.70 | |||
| 2003-04 | 2,677.60 | 1,361.70 | 148.00 | 40.90 | 164.60 | 923.30 | |||
| 2004-05 | 2,710.40 | 1,393.30 | 170.70 | 36.40 | 145.00 | 927.90 | |||
| 2005-06 | 2,751.80 | 1,412.50 | 174.70 | 42.00 | 143.60 | 943.50 | |||
| 2006-07 | 2,689.40 | 1,432.00 | 178.30 | 37.90 | 105.40 | 810.00 | |||
| 2007-08 | 2,673.40 | 1,402.00 | 175.40 | 42.90 | 101.90 | 824.10 | |||
| 2008-09 | 2,656.30 | 1,394.90 | 206.10 | 47.00 | 100.10 | 801.50 | |||
| 2009-10 | 2,816.46 | 1,440.04 | 177.92 | 52.06 | 124.84 | 904.08 | |||
| 2010-11 | 2,765.07 | 1,443.14 | 148.57 | 47.00 | 135.18 | 856.66 | |||
| 2011-12 | 2,666.60 | 1,388.33 | 171.65 | 49.86 | 123.26 | 829.56 | |||
| 2012-13 | 2,671.57 | 1,429.65 | 155.52 | 54.00 | 130.55 | 778.03 | |||
Teachers
| Midland ISD teachers[2] | |||||||||
|---|---|---|---|---|---|---|---|---|---|
| School year | Full-Time Equivalent (FTE) Teachers | Pupil/Teacher Ratio | Prekindergarten Teachers | Kindergarten Teachers | Elementary Teachers | Secondary Teachers | Ungraded Teachers | ||
| 1992-93 | 1,170.00 | 64.00 | 625.00 | 409.00 | |||||
| 1993-94 | 1,296.00 | 61.00 | 673.00 | 408.00 | |||||
| 1994-95 | 1,323.10 | 64.70 | 679.60 | 457.30 | |||||
| 1995-96 | 1,344.90 | 69.40 | 689.90 | 442.70 | |||||
| 1996-97 | 1,369.90 | 72.90 | 705.10 | 445.70 | |||||
| 1997-98 | 1,389.80 | 16.80 | 17.90 | 77.60 | 668.80 | 434.90 | 190.60 | ||
| 1998-99 | 1,415.60 | 16.20 | 15.90 | 85.40 | 698.70 | 464.10 | 151.50 | ||
| 1999-00 | 1,402.60 | 15.10 | 16.70 | 91.80 | 673.70 | 455.00 | 165.40 | ||
| 2000-01 | 1,384.90 | 14.80 | 9.90 | 84.40 | 665.60 | 488.10 | 136.90 | ||
| 2001-02 | 1,385.80 | 15.00 | 10.90 | 88.50 | 668.20 | 479.20 | 139.00 | ||
| 2002-03 | 1,402.00 | 14.80 | 31.00 | 87.00 | 677.00 | 468.60 | 138.40 | ||
| 2003-04 | 1,361.70 | 15.40 | 15.50 | 88.50 | 652.90 | 477.30 | 127.50 | ||
| 2004-05 | 1,393.40 | 14.90 | 28.50 | 95.80 | 646.00 | 472.20 | 150.80 | ||
| 2005-06 | 1,412.50 | 14.70 | 30.00 | 84.10 | 678.50 | 523.60 | 96.30 | ||
| 2006-07 | 1,432.00 | 14.60 | 36.00 | 91.50 | 688.70 | 448.40 | 167.40 | ||
| 2007-08 | 1,402.00 | 15.00 | 36.00 | 91.00 | 684.50 | 476.20 | 114.30 | ||
| 2008-09 | 1,394.90 | 15.40 | 35.00 | 91.50 | 669.70 | 497.20 | 101.50 | ||
| 2009-10 | 1,440.04 | 14.84 | 36.50 | 105.69 | 686.27 | 514.48 | 97.10 | ||
| 2010-11 | 1,443.14 | 15.06 | 39.87 | 107.65 | 672.53 | 529.99 | 93.10 | ||
| 2011-12 | 1,388.33 | 16.30 | 41.77 | 100.88 | 637.84 | 520.01 | 87.83 | ||
| 2012-13 | 1,429.65 | 16.31 | 40.16 | 105.94 | 658.78 | 520.37 | 104.40 | ||
Instructional, guidance and library
| Midland ISD instructional aides and coordinators, guidance counselors and library staff[2] | |||||||||
|---|---|---|---|---|---|---|---|---|---|
| School year | Instructional Aides | Instructional Coordinators | Total Guidance Counselors | Librarians/Media Specialists | Library Media Support Staff | ||||
| 1997-98 | 238.00 | 2.80 | 44.30 | 24.10 | |||||
| 1998-99 | 227.50 | 2.80 | 58.50 | 26.20 | |||||
| 1999-00 | 203.80 | 2.00 | 53.30 | 26.00 | |||||
| 2000-01 | 176.00 | 0.00 | 57.60 | 23.80 | |||||
| 2001-02 | 165.40 | 5.00 | 65.50 | 27.70 | |||||
| 2002-03 | 167.60 | 7.00 | 62.50 | 36.20 | |||||
| 2003-04 | 148.00 | 0.00 | 40.90 | 26.10 | |||||
| 2004-05 | 170.70 | 0.00 | 36.40 | 26.00 | |||||
| 2005-06 | 174.70 | 0.00 | 42.00 | 25.00 | |||||
| 2006-07 | 164.80 | 13.50 | 37.90 | 24.20 | 14.60 | ||||
| 2007-08 | 169.40 | 6.00 | 42.90 | 25.50 | 16.10 | ||||
| 2008-09 | 200.70 | 5.40 | 47.00 | 23.90 | 0.00 | ||||
| 2009-10 | 161.92 | 16.00 | 52.06 | 22.48 | 8.76 | ||||
| 2010-11 | 135.07 | 13.50 | 47.00 | 23.40 | 13.87 | ||||
| 2011-12 | 141.47 | 30.18 | 49.86 | 21.28 | 10.91 | ||||
| 2012-13 | 138.02 | 17.50 | 54.00 | 23.19 | 13.38 | ||||
Administration and support staff
| Midland ISD administration and support staff[2] | |||||||||
|---|---|---|---|---|---|---|---|---|---|
| School year | LEA Administrators | School Administrators | School Administrative Support Staff | Student Support Services Staff | Other Support Services Staff | ||||
| 1997-98 | 4.00 | 51.70 | 137.90 | 24.00 | 778.20 | ||||
| 1998-99 | 4.00 | 51.00 | 152.80 | 24.00 | 826.90 | ||||
| 1999-00 | 4.00 | 53.70 | 155.90 | 26.00 | 849.60 | ||||
| 2000-01 | 4.00 | 52.00 | 151.90 | 31.00 | 824.20 | ||||
| 2001-02 | 22.70 | 127.00 | 142.00 | 41.00 | 783.10 | ||||
| 2002-03 | 22.00 | 127.40 | 137.10 | 41.00 | 817.60 | ||||
| 2003-04 | 20.00 | 144.60 | 156.60 | 36.00 | 730.70 | ||||
| 2004-05 | 18.00 | 127.00 | 131.40 | 38.00 | 758.50 | ||||
| 2005-06 | 18.60 | 125.00 | 158.00 | 26.00 | 759.50 | ||||
| 2006-07 | 13.60 | 91.80 | 73.10 | 116.70 | 620.20 | ||||
| 2007-08 | 14.60 | 87.30 | 76.10 | 109.10 | 638.90 | ||||
| 2008-09 | 11.00 | 89.10 | 71.90 | 115.30 | 614.30 | ||||
| 2009-10 | 27.81 | 97.03 | 78.84 | 121.12 | 704.12 | ||||
| 2010-11 | 31.00 | 104.18 | 79.33 | 102.07 | 675.26 | ||||
| 2011-12 | 27.00 | 96.26 | 74.31 | 92.71 | 662.54 | ||||
| 2012-13 | 27.39 | 103.16 | 74.81 | 83.32 | 619.90 | ||||
See also
External links
Footnotes
- ↑ Midland, Texas, "Comprehensive Annual Financial Report for the Fiscal Year Ended September 30, 2013," accessed September 30, 2015
- ↑ 2.00 2.01 2.02 2.03 2.04 2.05 2.06 2.07 2.08 2.09 2.10 2.11 2.12 2.13 2.14 2.15 2.16 2.17 2.18 2.19 National Center for Education Statistics, "ELSI Table Generator," accessed September 30, 2015
- ↑ Note: This text is quoted verbatim from the original source. Any inconsistencies are attributable to the original source.
- ↑ Midland Reporter-Telegram, "Warren: Teachers appreciate re-signing bonus," May 11, 2014
| |||||


