File: Trifectas from 1992-2013 Pie Chart.png: Difference between revisions
From Ballotpedia
mNo edit summary |
(uploaded a new version of "File:Trifectas from 1992-2013 Pie Chart.png") |
(No difference)
| |
Latest revision as of 05:49, 21 May 2013
A pie chart showing the relative frequency of Democratic trifectas, Republican trifectas, and divided governments in the 50 states from 1992 to 2013.
you can send your inquiry to editor@ballotpedia.org |
File history
Click on a date/time to view the file as it appeared at that time.
| Date/Time | Thumbnail | Dimensions | User | Comment | |
|---|---|---|---|---|---|
| current | 05:49, 21 May 2013 | 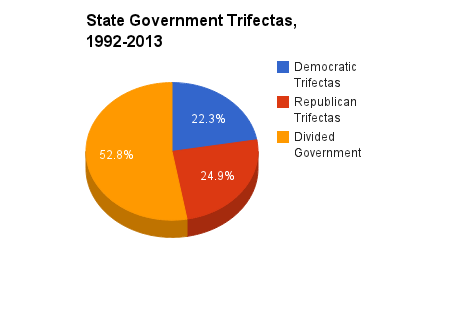 | 450 × 320 (13 KB) | Andymarshall (contribs) |
You cannot overwrite this file.
File usage
The following page uses this file: