Become part of the movement for unbiased, accessible election information. Donate today.
Northshore School District, Washington
| Northshore School District |
|---|
| Bothell, Washington |
| District details |
| Superintendent: Dr. Michelle Reid |
| # of school board members: 5 |
| Website: Link |
Northshore School District is a school district in Washington. The district was the 10th-largest school district in the state in the 2014-2015 school year and served 20,881 students.[1]
About the district
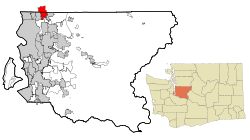
Northshore School District is based in Bothell, Washington and serves communities in King and Snohomish Counties. King County was home to an estimated 2,149,970 residents and Snohomish County was home to an estimated 787,620 residents between 2010 and 2016, according to the United States Census Bureau.[2].[3]
Demographics
King County outperformed and Snohomish County underperformed in comparison to Washington as a whole in terms of higher education attainment from 2011 to 2015. The United States Census Bureau found that 47.9 percent of King County residents and 29.9 percent of Snohomish County residents had attained a bachelor's degree or higher, compared to 32.9 percent for state residents. The median household income in King County was $75,302, while it was $70,722 in Snohomish County and $61,062 for the entire state. King County residents lived below the poverty level at a rate of 9.8 percent and Snohomish County residents did so at a rate of 9.3 percent, while that rate was 12.2 percent for the entire state.[2][3]
| Racial Demographics, 2015[2][3] | |||
|---|---|---|---|
| Race | King County (%) | Snohomish County (%) | Washington (%) |
| White | 69.5 | 79.7 | 80.3 |
| Black or African American | 6.8 | 3.2 | 4.1 |
| American Indian and Alaska Native | 1.1 | 1.6 | 1.9 |
| Asian | 16.9 | 10.4 | 8.4 |
| Native Hawaiian and Other Pacific Islander | 0.9 | 0.6 | 0.7 |
| Two or More Races | 5.0 | 4.5 | 4.6 |
| Hispanic or Latino | 9.5 | 9.9 | 12.4 |
Note: Percentages for race and ethnicity may add up to more than 100 percent because respondents may report more than one race and the Hispanic/Latino ethnicity may be selected in conjunction with any race. Read more about race and ethnicity in the census here.
Superintendent
| |
This information is updated as we become aware of changes. Please contact us with any updates. |
Dr. Michelle Reid (2016-Present)
The superintendent of Northshore School District is Dr. Michelle Reid. She was unanimously appointed by the board in June 2016 and began serving in this role on July 1, 2016. Before her appointment, she was the superintendent at South Kitsap School District. She also worked as deputy superintendent, district athletic director, and principal at the Port Angeles School District. Reid earned her Ph.D. in educational leadership from the University of Washington, her master’s in educational administration from the University of Washington, and her bachelor’s degree in natural science/chemistry from the University of Puget Sound.[4]
Past superintendents
Larry Francois (2008-2016)
Larry Francois served as superintendent from his appointment in March 2008 until he stepped down on June 30, 2016, to become the superintendent of the Northwest Educational Service District 189.[5] Francois previously worked for five years as the Superintendent of Lakewood School District.[6]
School board elections
The Northshore school board is a five-member board with each member elected by district to a four-year term. Each member can be compensated $50 per day for district matters with a maximum compensation of $4,800 per year.[7]
|
|||||||||||||||||||||||||||||
| |
This officeholder information was last updated on December 13, 2017. Please contact us with any updates. | |
Election dates
Members of the Northshore School Board are elected to four-year terms on a staggered basis. Three seats were up for election on November 5, 2013, and two seats were up for election on November 3, 2015. Four seats were up for election on November 7, 2017, including a special election for District 2.
Public participation in school board meetings
The Northshore School Board maintains the following policy about public testimony during board meetings:
| “ |
The board recognizes the value of public comment on educational issues and the importance of involving members of the public in its meetings. In order to permit fair and orderly expression of such comment, the board will provide a period at each regular meeting during which visitors may address the board. The board president may also choose to allow individuals to express an opinion prior to board action on agenda items. Individuals or groups wishing to make formal presentations to the board should contact the superintendent and/or board president. The board will determine if they wish to add the item to their agenda or if it should be appropriately addressed under the "Public Comments" portion of the meeting. Individuals wishing to be heard by the board shall first be recognized by the president. After identifying themselves, individuals should proceed to make comments as briefly as the subject permits. Patrons of the district or community members shall be given speaking time priority over other members of the public who do not receive services from the district. The president retains the right to interrupt or terminate an individual's statement when it is too lengthy, personally directed, abusive, obscene, irrelevant, etc. The board as a whole shall have the final decision in determining the appropriateness of all such rulings. Individuals with disabilities who may need a modification to participate in a meeting should contact the superintendent’s office no later than three days before a regular meeting and as soon as possible in advance of a special meeting so that arrangements for the modification can be made.[8] [9] |
” |
Budget
From 1993 to 2013, the Northshore School District had an average of $184,212,333 in revenue and $192,528,524 in expenditures, according to the United States Census Bureau's survey of school system finances. The district had a yearly average of $251,970,524 in outstanding debt. The district retired $20,546,095 of its debt and issued $29,488,429 in new debt each year on average.[10]
Revenue
The table below separates the district's revenue into the three sources identified by the agency: local, state, and federal.
| Revenue by Source | |||||||||||
|---|---|---|---|---|---|---|---|---|---|---|---|
| Fiscal Year |
Local | State | Federal | Revenue Total | |||||||
| Total | % of Revenue | Total | % of Revenue | Total | % of Revenue | ||||||
| Click [show] on the right to display the revenue data for prior years. | |||||||||||
|---|---|---|---|---|---|---|---|---|---|---|---|
| 1993 | $33,173,000 | 31.81% | $69,203,000 | 66.36% | $1,915,000 | 1.84% | $104,291,000 | ||||
| 1994 | $37,218,000 | 32.12% | $76,646,000 | 66.14% | $2,018,000 | 1.74% | $115,882,000 | ||||
| 1995 | $44,052,000 | 35.06% | $79,439,000 | 63.22% | $2,160,000 | 1.72% | $125,651,000 | ||||
| 1996 | $48,518,000 | 35.83% | $84,463,000 | 62.37% | $2,448,000 | 1.81% | $135,429,000 | ||||
| 1997 | $50,992,000 | 36.59% | $85,360,000 | 61.26% | $2,993,000 | 2.15% | $139,345,000 | ||||
| 1998 | $56,017,000 | 38.06% | $87,802,000 | 59.65% | $3,378,000 | 2.29% | $147,197,000 | ||||
| 1999 | $60,375,000 | 39.08% | $90,181,000 | 58.38% | $3,924,000 | 2.54% | $154,480,000 | ||||
| 2000 | $65,312,000 | 40.27% | $91,398,000 | 56.36% | $5,471,000 | 3.37% | $162,181,000 | ||||
| 2001 | $69,808,000 | 39.52% | $101,244,000 | 57.32% | $5,582,000 | 3.16% | $176,634,000 | ||||
| 2002 | $72,316,000 | 40.53% | $100,584,000 | 56.38% | $5,510,000 | 3.09% | $178,410,000 | ||||
| 2003 | $73,650,000 | 40.55% | $101,851,000 | 56.07% | $6,138,000 | 3.38% | $181,639,000 | ||||
| 2004 | $76,018,000 | 40.60% | $104,686,000 | 55.92% | $6,517,000 | 3.48% | $187,221,000 | ||||
| 2005 | $79,902,000 | 41.61% | $104,994,000 | 54.67% | $7,139,000 | 3.72% | $192,035,000 | ||||
| 2006 | $97,373,000 | 45.16% | $111,089,000 | 51.52% | $7,159,000 | 3.32% | $215,621,000 | ||||
| 2007 | $89,725,000 | 41.65% | $117,998,000 | 54.78% | $7,694,000 | 3.57% | $215,417,000 | ||||
| 2008 | $88,702,000 | 40.14% | $124,240,000 | 56.22% | $8,042,000 | 3.64% | $220,984,000 | ||||
| 2009 | $95,501,000 | 39.89% | $127,499,000 | 53.25% | $16,426,000 | 6.86% | $239,426,000 | ||||
| 2010 | $102,589,000 | 43.18% | $122,763,000 | 51.67% | $12,250,000 | 5.16% | $237,602,000 |
| 2011 | $105,642,000 | 43.73% | $120,130,000 | 49.73% | $15,803,000 | 6.54% | $241,575,000 |
| 2012 | $123,029,000 | 48.72% | $118,497,000 | 46.93% | $10,989,000 | 4.35% | $252,515,000 |
| 2013 | $108,326,000 | 44.23% | $126,785,000 | 51.77% | $9,813,000 | 4.01% | $244,924,000 |
| Avg. | $75,154,190 | 39.92% | $102,231,048 | 56.66% | $6,827,095 | 3.42% | $184,212,333 |
Expenditures
The table below separates the district's expenditures into five categories identified by the agency:
- Instruction: operation expenditures, state payments on behalf of the district for instruction and benefits, and retirement system transfers
- Support Services: support services, food services, and retirement system transfers for support service staff
- Capital Spending: capital outlay expenditures (i.e., construction, land or facilities purchases, and equipment purchases)
- Debt & Gov. Payments: payments to state and local governments and interest on school system debt
- Other: all other non-K-12 programs, except food services
| Expenditures by Category | |||||||||||
|---|---|---|---|---|---|---|---|---|---|---|---|
| Fiscal Year |
Instruction | Support Services | Capital Spending | Debt & Gov. Payments | Other | Budget Total | |||||
| Total | % of Budget | Total | % of Budget | Total | % of Budget | Total | % of Budget | Total | % of Budget | ||
| Click [show] on the right to display the expenditure data for prior years. | |||||||||||
|---|---|---|---|---|---|---|---|---|---|---|---|
| 1993 | $57,091,000 | 49.07% | $32,359,000 | 27.81% | $18,912,000 | 16.26% | $6,250,000 | 5.37% | $1,731,000 | 1.49% | $116,343,000 |
| 1994 | $58,399,000 | 45.70% | $33,069,000 | 25.88% | $27,857,000 | 21.80% | $6,715,000 | 5.25% | $1,746,000 | 1.37% | $127,786,000 |
| 1995 | $63,040,000 | 45.99% | $35,809,000 | 26.13% | $27,961,000 | 20.40% | $8,277,000 | 6.04% | $1,977,000 | 1.44% | $137,064,000 |
| 1996 | $65,744,000 | 48.95% | $37,721,000 | 28.09% | $19,979,000 | 14.88% | $8,859,000 | 6.60% | $2,000,000 | 1.49% | $134,303,000 |
| 1997 | $68,400,000 | 43.55% | $38,621,000 | 24.59% | $38,169,000 | 24.30% | $9,715,000 | 6.19% | $2,166,000 | 1.38% | $157,071,000 |
| 1998 | $74,308,000 | 45.62% | $43,132,000 | 26.48% | $32,801,000 | 20.14% | $10,079,000 | 6.19% | $2,559,000 | 1.57% | $162,879,000 |
| 1999 | $77,572,000 | 47.49% | $44,274,000 | 27.10% | $26,767,000 | 16.39% | $12,093,000 | 7.40% | $2,655,000 | 1.63% | $163,361,000 |
| 2000 | $76,945,000 | 45.80% | $47,095,000 | 28.03% | $28,903,000 | 17.20% | $12,309,000 | 7.33% | $2,765,000 | 1.65% | $168,017,000 |
| 2001 | $79,887,000 | 46.69% | $50,164,000 | 29.32% | $26,390,000 | 15.42% | $11,640,000 | 6.80% | $3,023,000 | 1.77% | $171,104,000 |
| 2002 | $82,956,000 | 46.19% | $51,348,000 | 28.59% | $30,873,000 | 17.19% | $11,405,000 | 6.35% | $3,034,000 | 1.69% | $179,616,000 |
| 2003 | $86,938,000 | 41.59% | $53,355,000 | 25.52% | $50,821,000 | 24.31% | $14,683,000 | 7.02% | $3,240,000 | 1.55% | $209,037,000 |
| 2004 | $88,880,000 | 46.05% | $56,328,000 | 29.18% | $32,470,000 | 16.82% | $12,254,000 | 6.35% | $3,073,000 | 1.59% | $193,005,000 |
| 2005 | $92,867,000 | 45.07% | $56,964,000 | 27.64% | $41,780,000 | 20.28% | $11,234,000 | 5.45% | $3,215,000 | 1.56% | $206,060,000 |
| 2006 | $97,988,000 | 50.94% | $60,259,000 | 31.33% | $18,901,000 | 9.83% | $11,850,000 | 6.16% | $3,358,000 | 1.75% | $192,356,000 |
| 2007 | $104,134,000 | 44.79% | $63,352,000 | 27.25% | $47,632,000 | 20.49% | $14,014,000 | 6.03% | $3,346,000 | 1.44% | $232,478,000 |
| 2008 | $107,197,000 | 45.89% | $65,686,000 | 28.12% | $42,415,000 | 18.16% | $15,024,000 | 6.43% | $3,284,000 | 1.41% | $233,606,000 |
| 2009 | $115,301,000 | 46.05% | $65,834,000 | 26.29% | $52,104,000 | 20.81% | $13,983,000 | 5.58% | $3,180,000 | 1.27% | $250,402,000 |
| 2010 | $111,245,000 | 44.00% | $64,432,000 | 25.49% | $60,124,000 | 23.78% | $13,588,000 | 5.37% | $3,423,000 | 1.35% | $252,812,000 |
| 2011 | $114,063,000 | 42.39% | $65,260,000 | 24.25% | $68,792,000 | 25.57% | $17,780,000 | 6.61% | $3,176,000 | 1.18% | $269,071,000 |
| 2012 | $116,293,000 | 45.62% | $68,923,000 | 27.04% | $49,700,000 | 19.50% | $16,851,000 | 6.61% | $3,123,000 | 1.23% | $254,890,000 |
| 2013 | $116,558,000 | 50.28% | $70,218,000 | 30.29% | $25,197,000 | 10.87% | $16,536,000 | 7.13% | $3,329,000 | 1.44% | $231,838,000 |
| Avg. | $88,371,714 | 46.08% | $52,581,095 | 27.35% | $36,597,524 | 18.78% | $12,149,476 | 6.30% | $2,828,714 | 1.49% | $192,528,524 |
Debt
The table below shows the amount of debt retired, issued, and outstanding in the district for each year.
| Debt | |||
|---|---|---|---|
| Fiscal Year |
Retired | Issued | Outstanding |
| Click [show] on the right to display the debt data for prior years. | |||
|---|---|---|---|
| 1993 | $5,310,000 | $5,435,000 | $110,436,000 |
| 1994 | $5,440,000 | $35,288,000 | $140,243,000 |
| 1995 | $5,165,000 | $0 | $135,078,000 |
| 1996 | $7,006,000 | $29,613,000 | $157,844,000 |
| 1997 | $9,184,000 | $25,000,000 | $173,461,000 |
| 1998 | $11,212,000 | $40,644,000 | $231,134,000 |
| 1999 | $10,680,000 | $34,385,000 | $254,964,000 |
| 2000 | $14,951,000 | $0 | $239,933,000 |
| 2001 | $18,095,000 | $0 | $221,778,000 |
| 2002 | $16,825,000 | $80,369,000 | $285,322,000 |
| 2003 | $20,141,000 | $4,060,000 | $271,166,000 |
| 2004 | $18,232,000 | $22,438,000 | $275,372,000 |
| 2005 | $20,064,000 | $0 | $246,974,000 |
| 2006 | $20,464,000 | $83,000,000 | $309,510,000 |
| 2007 | $20,624,000 | $0 | $288,886,000 |
| 2008 | $43,022,000 | $60,075,000 | $305,939,000 |
| 2009 | $24,440,000 | $0 | $281,499,000 |
| 2010 | $27,485,000 | $91,000,000 | $345,014,000 |
| 2011 | $31,085,000 | $30,000,000 | $343,929,000 |
| 2012 | $23,070,000 | $24,495,000 | $345,354,000 |
| 2013 | $78,973,000 | $53,455,000 | $327,545,000 |
| Avg. | $20,546,095 | $29,488,429 | $251,970,524 |
Teacher salaries
Northshore School District employed 1,115 K-12 teachers during the 2012-2013 school year. Teacher salaries are categorized based on higher education achievement, professional development and years of service. A teacher with a Bachelor's degree can earn higher salaries by pursuing graduate courses with raises at 15, 30, 45, 90 and 135 quarter credits. The current salary schedule sets higher starting salaries and maximum salaries for teachers with graduate degrees. The following table details the salary schedule for the 2012-2013 school year:[11]
| Salary structure | ||
|---|---|---|
| Degree level | Minimum salary ($) | Maximum salary ($) |
| B.A. | 34,696 | 39,589 |
| B.A. 15 | 35,633 | 41,986 |
| B.A. 30 | 36,604 | 44,538 |
| B.A. 45 | 37,576 | 49,247 |
| B.A. 90 | 40,698 | 58,886 |
| B.A. 135 | 42,709 | 61,784 |
| M.A. | 41,598 | 58,922 |
| M.A. 45 | 44,718 | 62,718 |
| M.A. 90 | 46,732 | 65,502 |
Unions
Teachers in the district are represented in negotiations by the Northshore Education Association (NEA). The NEA is currently led by Tim Brittell.[12]
Schools in district
Enrollment
The district served 20,881 K-12 students during the 2014-2015 school year, according to the National Center for Education Statistics. The district experienced a 2 percent increase in enrollment between 2008 and 2012, according to the Office of Superintendent of Public Instruction. The following chart details enrollment in the district between 2008 and 2012:[13]
| Total enrollment | ||
|---|---|---|
| Year | Enrollment | Year-to-year change (%) |
| 2008 | 19,514 | - |
| 2009 | 19,263 | -1.3 |
| 2010 | 19,328 | 0.3 |
| 2011 | 19,446 | 0.6 |
| 2012 | 19,918 | 2.4 |
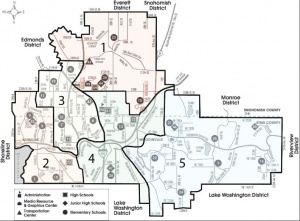
District schools
Northshore School District operates 32 K-12 schools listed below in alphabetical order:[14]
| Northshore School District |
|---|
| Arrowhead Elementary |
| Bear Creek Elementary |
| Bothell High School |
| Canyon Creek Elementary |
| Canyon Park Junior High |
| Cottage Lake Elementary |
| Crystal Springs Elementary |
| East Ridge Elementary |
| Fernwood Elementary |
| Frank Love Elementary |
| Hollywood Hill Elementary |
| Inglemoor High School |
| Kenmore Elementary |
| Kenmore Junior High |
| Kokanee Elementary |
| Leota Junior High |
| Lockwood Elementary |
| Maywood Hills Elementary |
| Moorlands Elementary |
| Northshore Junior High |
| Northshore Networks |
| Secondary Academy for Success |
| Shelton View Elementary |
| Skyview Junior High |
| Sorenson Early Childhood Center |
| Sunrise Elementary |
| Timbercrest Junior High |
| Wellington Elementary |
| Westhill Elementary |
| Woodin Elementary |
| Woodinville High School |
| Woodmoor Elementary |
Academic performance
The Washington Office of the Superintendent of Public Instruction published a state report card for 2011-2012 assessing subject proficiency levels and year-to-year progress for each district. This report card relies on data from the Measurements of Student Progress (MSP) and High School Proficiency Exam (HSPE) to determine if each district meets Annual Yearly Progress (AYP) goals in reading and math. The goal for each district was to meet proficiency goals at all grade levels and student demographics by the 2013-2014 school year.
Northshore School District met the state goal of 95% participation across all grade levels. The district did not meet AYP goals for reading at the elementary and middle school levels.[15]
MSP/HSPE Proficiency
| Student Proficiency Levels, 2011-2012 | ||
|---|---|---|
| Grade | Reading (%) | Math (%) |
| 3 | 85.0 | 75.9 |
| 4 | 84.7 | 78.5 |
| 5 | 85.6 | 76.7 |
| 6 | 85.1 | 80.9 |
| 7 | 79.0 | 80.6 |
| 8 | 80.2 | 73.1 |
| 10 | 92.1 | - |
Adequate Yearly Progress
| AYP Achievement, 2011-2012 | ||
|---|---|---|
| Grade | Meet Reading AYP? | Meet Math AYP? |
| Elementary School | No | Yes |
| Middle School | No | Yes |
| High School | Yes | Yes |
Contact information
![]()
Northshore School Board
3330 Monte Villa Parkway
Bothell, WA 98021
Phone: (425) 408-6001
See also
| Washington | School Board Elections | News and Analysis |
|---|---|---|
 |
 | |
External links
Footnotes
- ↑ U.S. Department of Education, National Center for Education Statistics, "Common Core of Data, file ccd_lea_052_1414_w_0216161a, 2014-2015," accessed November 16, 2016
- ↑ 2.0 2.1 2.2 United States Census Bureau, "State & County QuickFacts: King County, Washington," accessed June 5, 2017
- ↑ 3.0 3.1 3.2 United States Census Bureau, "Quick Facts: Snohomish County," accessed June 7, 2017
- ↑ Northshore School District, "Superintendent," accessed July 28, 2016
- ↑ Bothell/Kenmore Reporter, "Northshore School District Superintendent Larry Francois notifies school board of plan to resign," March 4, 2016
- ↑ Northshore School District, "Superintendent Bio," accessed August 26, 2013
- ↑ Northshore School District, "School Board," accessed August 26, 2013
- ↑ Northshore School District, "School Board Policies and Procedures," accessed July 28, 2016
- ↑ Note: This text is quoted verbatim from the original source. Any inconsistencies are attributable to the original source.
- ↑ United States Census Bureau, "Public School System Finances: Historical Data," accessed December 1, 2015
- ↑ Northshore School District, "Teachers' Total Salary Schedule," accessed August 26, 2013
- ↑ Northshore Education Association, "Home," accessed August 26, 2013
- ↑ Office of Superintendent of Public Instruction, "Student Enrollment Cohort Projections," accessed August 13, 2013
- ↑ Northshore School District, "Schools," accessed August 26, 2013
- ↑ Office of Superintendent of Public Instruction, "Washington State Report Card," accessed August 26, 2013