Help us improve in just 2 minutes—share your thoughts in our reader survey.
Terrebonne Parish School District, Louisiana
| Terrebonne Parish School District |
|---|
| Houma, Louisiana |
| District details |
| Superintendent: Philip Martin |
| # of school board members: 9 |
| Website: Link |
Terrebonne Parish School District is a school district in Louisiana that served 18,640 students during the 2012-2013 school year.[1] This district was the 13th-largest school district in Louisiana with an operating budget of $177.8 million for the 2014-2015 school year.
About the district
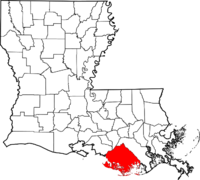
Terrebonne Parish School District is located in Terrebonne Parish, Louisiana. According to the United States Census Bureau, Terrebonne Parish is home to 112,749 residents.[2]
Demographics
Terrebonne Parish underperformed in comparison to the rest of Louisiana in terms of education achievement in 2012. The United States Census Bureau found that 13.8 percent of Terrebonne Parish residents aged 25 years and older had attained a bachelor's degree compared to 21.3 percent for Louisiana as a whole. The median household income for Terrebonne Parish was $49,545 compared to $44,673 for the state of Louisiana. The percentage of people below poverty level for Terrebonne Parish was 16.8 percent while it was 18.7 percent for the state of Louisiana.[2]
|
|||||||||||||||||||||||||||||
Note: Percentages for race and ethnicity may add up to more than 100 percent because respondents may report more than one race and the Hispanic/Latino ethnicity may be selected in conjunction with any race. Read more about race and ethnicity in the census here.
Superintendent
| |
This information is updated as we become aware of changes. Please contact us with any updates. |
Philip Martin was the superintendent of Terrebonne Parish School District as of 2014. Martin was appointed to this position in January 2009. In his first year as superintendent Martin oversaw a board approved budget cut that resulted in the termination of 300 employees.[3] In December 2013, the board extended Martin's contract through 2016.[4]
School board elections
The Terrebonne Parish School Board is composed of nine members elected in geographic area elections serving four-year terms.[5]
| Terrebonne Parish School Board | ||||
|---|---|---|---|---|
| Member | District | Party | Tenure Began | Term Ends |
| Roosevelt "Rosey" Thomas | 1 | Democrat |
January 1, 2003 | December 31, 2018 |
| Gregory Harding | 2 | Democrat |
January 1, 2003 | December 31, 2018 |
| Richard "Dicky" Jackson | 3 | Democrat |
January 1, 2003 | December 31, 2018 |
| Debra "Debi" Benoit | 4 | Republican |
January 1, 2011 | December 31, 2018 |
| Brenda Leroux Babin | 5 | Democrat |
January 1, 2011 | December 31, 2018 |
| L. P. Bordelon III | 6 | Republican |
January 1, 2003 | December 31, 2018 |
| Roger Dale DeHart | 7 | Democrat |
1990 | December 31, 2018 |
| Donald "Don" Duplantis | 8 | Democrat |
1994 | December 31, 2018 |
| Vicki Bonvillain | 9 | Republican |
January 1, 2015 | December 31, 2018 |
| |
This officeholder information was last updated on December 11, 2017. Please contact us with any updates. | |
Election dates
Members of the Terrebonne Parish School Board are elected to four-year terms. The primary election for nine seats was held on November 4, 2014, and the general election was held on December 6, 2014.[6] No seats were up for election in 2012, and no seats will be up for election in 2015.
Public participation in board meetings
The school board maintains the following policy regarding public participation in board meetings last updated in 2010:[7]
| “ | It is the policy of the Terrebonne Parish School Board to conduct all meetings in full view
of and with welcomed participation by the public. However, the Board reserves the right to recess into or call executive sessions for discussing matters as provided by law. At no time shall actions be taken or resolutions made during executive sessions. The Terrebonne Parish School Board may seek the advice and counsel of citizens in planning and operating the schools through committee service. Meetings of the Terrebonne Parish School Board shall be open to the public. All citizen communications to the Board shall be addressed to the Terrebonne Parish School Board. To facilitate the conduct of its meetings, citizens who wish to present any matter of concern to the schools at a Board meeting must give a minimum of five (5) days written notice to the Superintendent and said notice shall include the subject to be discussed. (Items to be placed on the agenda for Tuesday night meetings must be submitted by noon on Wednesday prior to the meetings). The President shall allot a visitor not more than five (5) minutes to speak before the Board, unless the time is increased or decreased by a majority vote of the Board.[8] |
” |
Budget
From 1993 to 2013, the Terrebonne Parish School District had an average of $136,356,762 in revenue and $132,652,667 in expenditures, according to the United States Census Bureau's survey of school system finances. The district had a yearly average of $11,509,238 in outstanding debt. The district retired $2,126,619 of its debt and issued $2,352,857 in new debt each year on average.[9]
Revenue
The table below separates the district's revenue into the three sources identified by the agency: local, state, and federal.
| Revenue by Source | |||||||||||
|---|---|---|---|---|---|---|---|---|---|---|---|
| Fiscal Year |
Local | State | Federal | Revenue Total | |||||||
| Total | % of Revenue | Total | % of Revenue | Total | % of Revenue | ||||||
| Click [show] on the right to display the revenue data for prior years. | |||||||||||
|---|---|---|---|---|---|---|---|---|---|---|---|
| 1993 | $19,967,000 | 27.00% | $45,363,000 | 61.35% | $8,616,000 | 11.65% | $73,946,000 | ||||
| 1994 | $20,898,000 | 27.21% | $45,692,000 | 59.48% | $10,225,000 | 13.31% | $76,815,000 | ||||
| 1995 | $22,553,000 | 27.72% | $48,186,000 | 59.22% | $10,635,000 | 13.07% | $81,374,000 | ||||
| 1996 | $22,302,000 | 27.28% | $47,750,000 | 58.41% | $11,694,000 | 14.31% | $81,746,000 | ||||
| 1997 | $36,256,000 | 36.59% | $50,829,000 | 51.29% | $12,012,000 | 12.12% | $99,097,000 | ||||
| 1998 | $41,947,000 | 37.13% | $58,400,000 | 51.70% | $12,612,000 | 11.17% | $112,959,000 | ||||
| 1999 | $41,183,000 | 35.07% | $63,119,000 | 53.76% | $13,115,000 | 11.17% | $117,417,000 | ||||
| 2000 | $41,744,000 | 34.65% | $65,038,000 | 53.98% | $13,703,000 | 11.37% | $120,485,000 | ||||
| 2001 | $43,314,000 | 34.57% | $66,964,000 | 53.45% | $15,011,000 | 11.98% | $125,289,000 | ||||
| 2002 | $41,214,000 | 32.12% | $70,429,000 | 54.89% | $16,662,000 | 12.99% | $128,305,000 | ||||
| 2003 | $44,396,000 | 33.21% | $71,512,000 | 53.49% | $17,773,000 | 13.30% | $133,681,000 | ||||
| 2004 | $42,018,000 | 31.11% | $73,758,000 | 54.61% | $19,295,000 | 14.29% | $135,071,000 | ||||
| 2005 | $45,854,000 | 32.77% | $73,637,000 | 52.62% | $20,455,000 | 14.62% | $139,946,000 | ||||
| 2006 | $60,822,000 | 36.08% | $80,423,000 | 47.71% | $27,313,000 | 16.20% | $168,558,000 | ||||
| 2007 | $64,327,000 | 38.25% | $82,077,000 | 48.81% | $21,752,000 | 12.94% | $168,156,000 | ||||
| 2008 | $63,248,000 | 34.97% | $95,609,000 | 52.86% | $22,016,000 | 12.17% | $180,873,000 | ||||
| 2009 | $70,332,000 | 36.75% | $97,662,000 | 51.03% | $23,375,000 | 12.21% | $191,369,000 | ||||
| 2010 | $56,525,000 | 31.50% | $89,891,000 | 50.09% | $33,037,000 | 18.41% | $179,453,000 |
| 2011 | $58,232,000 | 32.45% | $84,625,000 | 47.16% | $36,596,000 | 20.39% | $179,453,000 |
| 2012 | $60,645,000 | 32.14% | $94,157,000 | 49.90% | $33,874,000 | 17.95% | $188,676,000 |
| 2013 | $63,989,000 | 35.39% | $88,526,000 | 48.96% | $28,308,000 | 15.66% | $180,823,000 |
| Avg. | $45,798,381 | 33.05% | $71,126,048 | 53.08% | $19,432,333 | 13.87% | $136,356,762 |
Expenditures
The table below separates the district's expenditures into five categories identified by the agency:
- Instruction: operation expenditures, state payments on behalf of the district for instruction and benefits, and retirement system transfers
- Support Services: support services, food services, and retirement system transfers for support service staff
- Capital Spending: capital outlay expenditures (i.e., construction, land or facilities purchases, and equipment purchases)
- Debt & Gov. Payments: payments to state and local governments and interest on school system debt
- Other: all other non-K-12 programs, except food services
| Expenditures by Category | |||||||||||
|---|---|---|---|---|---|---|---|---|---|---|---|
| Fiscal Year |
Instruction | Support Services | Capital Spending | Debt & Gov. Payments | Other | Budget Total | |||||
| Total | % of Budget | Total | % of Budget | Total | % of Budget | Total | % of Budget | Total | % of Budget | ||
| Click [show] on the right to display the expenditure data for prior years. | |||||||||||
|---|---|---|---|---|---|---|---|---|---|---|---|
| 1993 | $42,981,000 | 58.89% | $27,250,000 | 37.33% | $897,000 | 1.23% | $1,607,000 | 2.20% | $253,000 | 0.35% | $72,988,000 |
| 1994 | $43,822,000 | 58.50% | $28,290,000 | 37.76% | $1,605,000 | 2.14% | $919,000 | 1.23% | $275,000 | 0.37% | $74,911,000 |
| 1995 | $45,208,000 | 58.67% | $28,647,000 | 37.18% | $2,089,000 | 2.71% | $839,000 | 1.09% | $275,000 | 0.36% | $77,058,000 |
| 1996 | $45,904,000 | 58.60% | $29,164,000 | 37.23% | $2,247,000 | 2.87% | $709,000 | 0.91% | $309,000 | 0.39% | $78,333,000 |
| 1997 | $56,781,000 | 59.04% | $34,288,000 | 35.65% | $4,091,000 | 4.25% | $605,000 | 0.63% | $409,000 | 0.43% | $96,174,000 |
| 1998 | $63,396,000 | 59.77% | $36,653,000 | 34.56% | $5,113,000 | 4.82% | $509,000 | 0.48% | $391,000 | 0.37% | $106,062,000 |
| 1999 | $69,734,000 | 56.06% | $39,806,000 | 32.00% | $13,526,000 | 10.87% | $765,000 | 0.62% | $554,000 | 0.45% | $124,385,000 |
| 2000 | $70,229,000 | 59.28% | $39,707,000 | 33.52% | $7,393,000 | 6.24% | $723,000 | 0.61% | $423,000 | 0.36% | $118,475,000 |
| 2001 | $70,549,000 | 59.74% | $42,760,000 | 36.21% | $3,790,000 | 3.21% | $543,000 | 0.46% | $443,000 | 0.38% | $118,085,000 |
| 2002 | $77,571,000 | 60.96% | $43,824,000 | 34.44% | $5,050,000 | 3.97% | $328,000 | 0.26% | $472,000 | 0.37% | $127,245,000 |
| 2003 | $79,406,000 | 60.35% | $47,320,000 | 35.97% | $4,060,000 | 3.09% | $259,000 | 0.20% | $520,000 | 0.40% | $131,565,000 |
| 2004 | $81,638,000 | 60.99% | $48,457,000 | 36.20% | $2,960,000 | 2.21% | $141,000 | 0.11% | $664,000 | 0.50% | $133,860,000 |
| 2005 | $81,251,000 | 60.84% | $48,903,000 | 36.62% | $2,706,000 | 2.03% | $83,000 | 0.06% | $614,000 | 0.46% | $133,557,000 |
| 2006 | $88,860,000 | 60.89% | $53,271,000 | 36.50% | $3,173,000 | 2.17% | $60,000 | 0.04% | $564,000 | 0.39% | $145,928,000 |
| 2007 | $96,820,000 | 59.31% | $57,144,000 | 35.01% | $8,703,000 | 5.33% | $41,000 | 0.03% | $526,000 | 0.32% | $163,234,000 |
| 2008 | $107,181,000 | 58.69% | $63,137,000 | 34.57% | $11,745,000 | 6.43% | $25,000 | 0.01% | $533,000 | 0.29% | $182,621,000 |
| 2009 | $110,151,000 | 57.25% | $70,647,000 | 36.72% | $11,044,000 | 5.74% | $8,000 | 0.00% | $551,000 | 0.29% | $192,401,000 |
| 2010 | $109,332,000 | 61.34% | $64,720,000 | 36.31% | $3,551,000 | 1.99% | $56,000 | 0.03% | $567,000 | 0.32% | $178,226,000 |
| 2011 | $104,211,000 | 61.49% | $62,103,000 | 36.64% | $2,529,000 | 1.49% | $110,000 | 0.06% | $534,000 | 0.32% | $169,487,000 |
| 2012 | $104,482,000 | 56.23% | $74,849,000 | 40.28% | $5,789,000 | 3.12% | $142,000 | 0.08% | $538,000 | 0.29% | $185,800,000 |
| 2013 | $97,042,000 | 55.35% | $65,923,000 | 37.60% | $10,670,000 | 6.09% | $1,100,000 | 0.63% | $576,000 | 0.33% | $175,311,000 |
| Avg. | $78,407,095 | 59.16% | $47,945,857 | 36.11% | $5,368,143 | 3.91% | $455,810 | 0.46% | $475,762 | 0.37% | $132,652,667 |
Debt
The table below shows the amount of debt retired, issued, and outstanding in the district for each year.
| Debt | |||
|---|---|---|---|
| Fiscal Year |
Retired | Issued | Outstanding |
| Click [show] on the right to display the debt data for prior years. | |||
|---|---|---|---|
| 1993 | $13,195,000 | $14,390,000 | $19,410,000 |
| 1994 | $1,695,000 | $0 | $17,715,000 |
| 1995 | $1,860,000 | $0 | $15,855,000 |
| 1996 | $2,020,000 | $0 | $13,835,000 |
| 1997 | $2,165,000 | $0 | $11,670,000 |
| 1998 | $2,310,000 | $0 | $9,360,000 |
| 1999 | $4,607,000 | $11,710,000 | $16,463,000 |
| 2000 | $3,995,000 | $789,000 | $13,257,000 |
| 2001 | $4,337,000 | $0 | $8,920,000 |
| 2002 | $1,511,000 | $1,030,000 | $8,439,000 |
| 2003 | $1,641,000 | $0 | $6,798,000 |
| 2004 | $1,526,000 | $30,000 | $5,302,000 |
| 2005 | $942,000 | $0 | $4,360,000 |
| 2006 | $702,000 | $0 | $3,658,000 |
| 2007 | $628,000 | $0 | $3,030,000 |
| 2008 | $605,000 | $0 | $2,425,000 |
| 2009 | $620,000 | $0 | $1,805,000 |
| 2010 | $75,000 | $10,000,000 | $11,730,000 |
| 2011 | $75,000 | $10,000,000 | $21,655,000 |
| 2012 | $75,000 | $1,461,000 | $23,041,000 |
| 2013 | $75,000 | $0 | $22,966,000 |
| Avg. | $2,126,619 | $2,352,857 | $11,509,238 |
Teacher salaries
Terrebonne Parish School District employed 1,433 K-12 teachers during the 2012-2013 school year.[1] Teacher salaries are categorized based on higher education achievement, professional development and years of service. A teacher with a bachelor's degree can earn higher salaries by pursuing graduate courses with raises at credit intervals. The salary schedule also accounts for graduate degrees by providing higher starting salaries and greater potential salaries. The following table details the salary schedule negotiated between the district and the Louisiana Association of Educators for 2013-2014:[10]
| Salary structure | ||
|---|---|---|
| Degree level | Minimum salary ($) | Maximum salary ($) |
| Two Years College | 32,688 | 37,223 |
| Three Years College | 33,452 | 38,233 |
| Bachelor's | 37,909 | 47,468 |
| Master's | 38,838 | 49,787 |
| M.A. + 30 | 38,838 | 51,031 |
| Ed.S | 39,484 | 51,756 |
| Ph.D. | 40,341 | 52,212 |
Schools in Terrebonne Parish School District
Enrollment
Terrebonne Parish School District served 18,640 students during the 2012-2013 school year. Terrebonne Parish School District does not publicly archive enrollment data.[1]
District schools
Terrebonne Parish School District operates 37 schools listed below in alphabetical order:[11]
| Terrebonne Parish School District | ||
|---|---|---|
| School Name | ||
| Acadian Elementary | ||
| Andrew Price Alternative | ||
| Bayou Black Elementary | ||
| Bayou Cane Adult Education | ||
| Bourg Elementary | ||
| Broadmoor Elementary | ||
| Caldwell Middle | ||
| Coteau Bayou Blue Elementary | ||
| Dularge Elementary | ||
| Dularge Middle | ||
| East Houma Elementary | ||
| East Street Alternative | ||
| Ellender Memorial High | ||
| Elysian Fields Middle | ||
| Evergreen Jr. High | ||
| Gibson Elementary | ||
| Grand Caillou Elementary | ||
| Grand Caillou Middle | ||
| H.L. Bourgeois High | ||
| Honduras Elementary | ||
| Houma Jr. High | ||
| Juvenile Justice System | ||
| Lacache Middle | ||
| Legion Park Middle | ||
| Lisa Park Elementary | ||
| Montegut Elementary | ||
| Montegut Middle | ||
| Mulberry Elementary | ||
| Oaklawn Jr. High | ||
| Oakshire Elementary | ||
| Pointe-aux-Chenes Elementary | ||
| School For Exceptional Children | ||
| Schriever Elementary | ||
| South Terrebonne High | ||
| Southdown Elementary | ||
| Terrebonne Career and Technical High | ||
| Terrebonne High | ||
| Upper Little Caillou Elementary | ||
| Village East Middle | ||
Academic performance
Louisiana Educational Assessment Program (LEAP) is a series of annual assessments in English language arts, mathematics, science and social studies in fourth and eighth grades. Known as a criterion-based test, these tests are aligned to the state academic standards and determine whether a student has mastered those standards.
The state has rules regarding the LEAP scores a student must earn to progress to fifth and ninth grade. However, for the next two years, districts will have more flexibility to make decisions based on additional academic indicators as the state transitions to new assessments.[12]
| Terrebonne Parish, Grade 4: All Testers, 2013 | |||||
|---|---|---|---|---|---|
| Subject | % Advanced | % Mastery | % Basic | % Approaching Basic | % Unsatisfactory |
| English Language Arts | 8 | 27 | 43 | 14 | 8 |
| Mathematics | 13 | 24 | 37 | 13 | 13 |
| Social Studies | 5 | 19 | 47 | 22 | 7 |
| Science | 3 | 17 | 53 | 17 | 10 |
| Terrebonne Parish, Grade 8: All Testers, 2013 | |||||
|---|---|---|---|---|---|
| Subject | % Advanced | % Mastery | % Basic | % Approaching Basic | % Unsatisfactory |
| English Language Arts | 4 | 20 | 44 | 24 | 8 |
| Mathematics | 4 | 7 | 51 | 21 | 17 |
| Social Studies | 2 | 18 | 43 | 26 | 10 |
| Science | ≤1 | 14 | 50 | 21 | 14 |
Contact information

Terrebonne Parish School District
201 Stadium Dr.
Houma, LA 70360
Phone: (985) 876-7400
See also
- Louisiana
- Louisiana school districts
- List of school districts in Louisiana
- Terrebonne Parish School District elections (2014)
- School board elections portal
External links
- Terrebonne Parish School District
- Louisiana Association of Educators
- Terrebonne Parish, Louisiana
- Louisiana Department of Education
- Louisiana School Board Association
Footnotes
- ↑ 1.0 1.1 1.2 Louisiana Education Results, "Terrebonne Parish," accessed April 29, 2014
- ↑ 2.0 2.1 2.2 United States Census Bureau, "Terrebonne Parish, Louisiana," accessed April 29, 2013
- ↑ Matthew Pleasant, Daily Comet.com, "Terrebonne public schools chief gets high marks," June 23, 2010
- ↑ John Harper, Houma Today.com, "Terrebonne schools chief's contract extended 2 years," December 3, 2013
- ↑ Terrebone Parish School District, "Board Members," accessed April 29, 2014
- ↑ Louisiana Secretary of State, "Elections Calendar," accessed April 28, 2014
- ↑ Terrebonne Parish School District, "Public Participation," accessed April 29, 2014
- ↑ Note: This text is quoted verbatim from the original source. Any inconsistencies are attributable to the original source.
- ↑ United States Census Bureau, "Public School System Finances: Historical Data," accessed December 1, 2015
- ↑ Terrebonne Parish School District, "182 Day Teacher/Professional Salary Scale," accessed April 29, 2014 (dead link)
- ↑ Terrebonne Parish School District, "Schools," accessed April 29, 2014
- ↑ Louisiana Believes.com, "Spring 2013 LEAP Criterion-Referenced Test," accessed April 29, 2014
| |||||
