Rio Rancho Public Schools, New Mexico
Ballotpedia provides comprehensive election coverage of the 100 largest cities in America by population as well as mayoral, city council, and district attorney election coverage in state capitals outside of the 100 largest cities. This school district is outside of that coverage scope and does not receive scheduled updates.
| Rio Rancho Public Schools |
|---|
| Rio Rancho, New Mexico |
| District details |
| Superintendent: Dr. Sue Cleveland |
| # of school board members: 5 |
| Website: Link |
Rio Rancho Public Schools is a school district in New Mexico that served 16,884 students in 19 schools during the 2012-2013 school year.[1] This district was the third-largest by enrollment in the state of New Mexico.
About the district
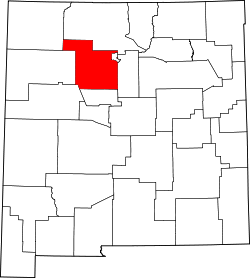
The Rio Rancho Public school district is located in Sandoval County in northern New Mexico. The county seat is Bernalillo. Sandoval County was home to an estimated 139,394 residents in 2015, according to the United States Census Bureau.[2]
Demographics
Sandoval County outperformed compared to New Mexico as a whole in terms of higher education achievement between 2011 and 2015. The United States Census Bureau found that 28.5 percent of county residents aged 25 years and older had attained a bachelor's degree, compared to 26.3 percent of state residents. The median household income for the county was $58,982, compared to $44,963 for the entire state. The percentage of people below the poverty level in the county was 11.2 percent, while it was 20.4 percent statewide.[2]
| Racial Demographics, 2015[2] | |||
|---|---|---|---|
| Race | Sandoval County (%) | New Mexico (%) | |
| White | 79.0 | 82.5 | |
| Black or African American | 2.6 | 2.6 | |
| American Indian and Alaska Native | 13.8 | 10.5 | |
| Asian | 1.6 | 1.7 | |
| Native Hawaiian or Other Pacific Islander | 0.2 | 0.2 | |
| Two or more races | 2.8 | 2.5 | |
| Hispanic or Latino | 37.8 | 48.0 | |
Note: Percentages for race and ethnicity may add up to more than 100 percent because respondents may report more than one race and the Hispanic/Latino ethnicity may be selected in conjunction with any race. Read more about race and ethnicity in the census here.
Superintendent
| |
This information is updated as we become aware of changes. Please contact us with any updates. |
The superintendent of Rio Rancho Public Schools is Dr. Sue Cleveland. Cleveland has served in this position since the creation of the district in 1994. She is paid an annual salary of $151,880 per year.[3] Cleveland previously served as superintendent of Cherokee County Schools in South Carolina and has held various teaching and administrative positions. She earned a bachelor's degree from the University of New Mexico, master's from New Mexico State University, and doctorate from the University of Houston, and she did post-graduate work at the University of South Carolina.[4]
School board elections
Rio Rancho Public Schools schools are overseen by a five-member board elected to four-year terms.[5]
| Rio Rancho Public Schools Board of Education | |||
|---|---|---|---|
| Member | District | Assumed Office | Term Ends |
| Wynne Coleman | 1 | 2017 | 2021 |
| Ramon Montano | 2 | 2015 | 2019 |
| Martha Janssen | 3 | 2013 | 2021 |
| Ryan Parra | 4 | 2015 | 2019 |
| Catherine Cullen | 5 | 2013 | 2021 |
| |
This officeholder information was last updated on April 10, 2018. Please contact us with any updates. | |
Election dates
Members of the Rio Rancho Public Schools Board of Education are elected to four-year terms. Elections are held the first Tuesday in February every odd-numbered year.[5] Two seats were up for election on February 3, 2015, and three seats were up for election on February 7, 2017.
Public participation in board meetings
The Rio Rancho Public Schools board of education does not maintain a specific policy on public testimony during board meetings.[6]
Budget
From 1995 to 2013, the Rio Rancho school district had an average of $94,653,579 in revenue and $97,671,316 in expenditures, according to the United States Census Bureau's survey of school system finances. The district had a yearly average of $70,521,579 in outstanding debt. The district retired $8,157,632 of its debt and issued $15,383,684 in new debt each year on average.[7]
Revenue
The table below separates the district's revenue into the three sources identified by the agency: local, state, and federal.
| Revenue by Source | |||||||||||
|---|---|---|---|---|---|---|---|---|---|---|---|
| Fiscal Year |
Local | State | Federal | Revenue Total | |||||||
| Total | % of Revenue | Total | % of Revenue | Total | % of Revenue | ||||||
| Click [show] on the right to display the revenue data for prior years. | |||||||||||
|---|---|---|---|---|---|---|---|---|---|---|---|
| 1995 | $6,186,000 | 20.61% | $23,467,000 | 78.18% | $363,000 | 1.21% | $30,016,000 | ||||
| 1996 | $8,994,000 | 26.70% | $23,409,000 | 69.49% | $1,283,000 | 3.81% | $33,686,000 | ||||
| 1997 | $7,301,000 | 21.89% | $24,710,000 | 74.09% | $1,341,000 | 4.02% | $33,352,000 | ||||
| 1998 | $8,473,000 | 17.47% | $38,344,000 | 79.04% | $1,694,000 | 3.49% | $48,511,000 | ||||
| 1999 | $8,840,000 | 16.65% | $42,376,000 | 79.81% | $1,878,000 | 3.54% | $53,094,000 | ||||
| 2000 | $12,618,000 | 21.33% | $43,750,000 | 73.97% | $2,779,000 | 4.70% | $59,147,000 | ||||
| 2001 | $10,743,000 | 17.22% | $48,351,000 | 77.52% | $3,278,000 | 5.26% | $62,372,000 | ||||
| 2002 | $11,172,000 | 16.01% | $54,815,000 | 78.55% | $3,798,000 | 5.44% | $69,785,000 | ||||
| 2003 | $11,085,000 | 15.06% | $57,953,000 | 78.76% | $4,547,000 | 6.18% | $73,585,000 | ||||
| 2004 | $12,350,000 | 15.08% | $63,396,000 | 77.39% | $6,173,000 | 7.54% | $81,919,000 | ||||
| 2005 | $13,533,000 | 13.83% | $78,333,000 | 80.03% | $6,012,000 | 6.14% | $97,878,000 | ||||
| 2006 | $15,377,000 | 13.60% | $92,300,000 | 81.61% | $5,416,000 | 4.79% | $113,093,000 | ||||
| 2007 | $18,915,000 | 15.82% | $95,645,000 | 79.97% | $5,040,000 | 4.21% | $119,600,000 | ||||
| 2008 | $50,474,000 | 30.51% | $109,903,000 | 66.44% | $5,035,000 | 3.04% | $165,412,000 | ||||
| 2009 | $29,430,000 | 19.67% | $114,004,000 | 76.18% | $6,216,000 | 4.15% | $149,650,000 | ||||
| 2010 | $32,290,000 | 20.91% | $105,160,000 | 68.08% | $17,008,000 | 11.01% | $154,458,000 |
| 2011 | $32,474,000 | 21.21% | $108,397,000 | 70.79% | $12,247,000 | 8.00% | $153,118,000 |
| 2012 | $31,880,000 | 21.50% | $108,757,000 | 73.36% | $7,614,000 | 5.14% | $148,251,000 |
| 2013 | $32,282,000 | 21.31% | $111,678,000 | 73.72% | $7,531,000 | 4.97% | $151,491,000 |
| Avg. | $18,653,526 | 19.28% | $70,776,211 | 75.63% | $5,223,842 | 5.09% | $94,653,579 |
Expenditures
The table below separates the district's expenditures into five categories identified by the agency:
- Instruction: operation expenditures, state payments on behalf of the district for instruction and benefits, and retirement system transfers
- Support Services: support services, food services, and retirement system transfers for support service staff
- Capital Spending: capital outlay expenditures (i.e., construction, land or facilities purchases, and equipment purchases)
- Debt & Gov. Payments: payments to state and local governments and interest on school system debt
- Other: all other non-K-12 programs, except food services
| Expenditures by Category | |||||||||||
|---|---|---|---|---|---|---|---|---|---|---|---|
| Fiscal Year |
Instruction | Support Services | Capital Spending | Debt & Gov. Payments | Other | Budget Total | |||||
| Total | % of Budget | Total | % of Budget | Total | % of Budget | Total | % of Budget | Total | % of Budget | ||
| Click [show] on the right to display the expenditure data for prior years. | |||||||||||
|---|---|---|---|---|---|---|---|---|---|---|---|
| 1995 | $13,280,000 | 48.46% | $9,281,000 | 33.87% | $4,445,000 | 16.22% | $393,000 | 1.43% | $5,000 | 0.02% | $27,404,000 |
| 1996 | $13,801,000 | 29.98% | $10,248,000 | 22.26% | $20,904,000 | 45.41% | $1,065,000 | 2.31% | $13,000 | 0.03% | $46,031,000 |
| 1997 | $14,947,000 | 40.08% | $12,547,000 | 33.65% | $8,553,000 | 22.94% | $1,222,000 | 3.28% | $23,000 | 0.06% | $37,292,000 |
| 1998 | $23,046,000 | 41.93% | $17,797,000 | 32.38% | $12,413,000 | 22.59% | $1,492,000 | 2.71% | $212,000 | 0.39% | $54,960,000 |
| 1999 | $26,352,000 | 44.13% | $19,109,000 | 32.00% | $12,329,000 | 20.65% | $1,699,000 | 2.85% | $227,000 | 0.38% | $59,716,000 |
| 2000 | $27,166,000 | 50.62% | $19,864,000 | 37.01% | $4,701,000 | 8.76% | $1,757,000 | 3.27% | $177,000 | 0.33% | $53,665,000 |
| 2001 | $28,227,000 | 51.07% | $20,501,000 | 37.09% | $4,445,000 | 8.04% | $1,894,000 | 3.43% | $204,000 | 0.37% | $55,271,000 |
| 2002 | $32,463,000 | 38.58% | $23,570,000 | 28.01% | $25,710,000 | 30.56% | $2,121,000 | 2.52% | $277,000 | 0.33% | $84,141,000 |
| 2003 | $36,257,000 | 48.84% | $26,351,000 | 35.50% | $9,135,000 | 12.31% | $2,122,000 | 2.86% | $369,000 | 0.50% | $74,234,000 |
| 2004 | $42,238,000 | 52.42% | $29,692,000 | 36.85% | $5,888,000 | 7.31% | $2,084,000 | 2.59% | $677,000 | 0.84% | $80,579,000 |
| 2005 | $46,695,000 | 42.83% | $31,685,000 | 29.07% | $27,861,000 | 25.56% | $2,028,000 | 1.86% | $744,000 | 0.68% | $109,013,000 |
| 2006 | $55,218,000 | 50.66% | $36,316,000 | 33.32% | $13,921,000 | 12.77% | $2,178,000 | 2.00% | $1,358,000 | 1.25% | $108,991,000 |
| 2007 | $64,900,000 | 55.69% | $41,064,000 | 35.24% | $7,852,000 | 6.74% | $2,113,000 | 1.81% | $601,000 | 0.52% | $116,530,000 |
| 2008 | $74,779,000 | 47.20% | $44,501,000 | 28.09% | $35,904,000 | 22.66% | $2,571,000 | 1.62% | $689,000 | 0.43% | $158,444,000 |
| 2009 | $76,246,000 | 42.68% | $45,658,000 | 25.56% | $51,618,000 | 28.89% | $3,950,000 | 2.21% | $1,168,000 | 0.65% | $178,640,000 |
| 2010 | $75,901,000 | 46.67% | $47,541,000 | 29.23% | $33,921,000 | 20.86% | $4,466,000 | 2.75% | $820,000 | 0.50% | $162,649,000 |
| 2011 | $76,936,000 | 50.78% | $49,219,000 | 32.48% | $19,675,000 | 12.99% | $4,786,000 | 3.16% | $901,000 | 0.59% | $151,517,000 |
| 2012 | $74,318,000 | 52.13% | $48,065,000 | 33.71% | $14,327,000 | 10.05% | $4,764,000 | 3.34% | $1,098,000 | 0.77% | $142,572,000 |
| 2013 | $79,067,000 | 51.31% | $51,017,000 | 33.11% | $18,433,000 | 11.96% | $4,473,000 | 2.90% | $1,116,000 | 0.72% | $154,106,000 |
| Avg. | $46,412,474 | 46.63% | $30,738,211 | 32.02% | $17,475,526 | 18.28% | $2,483,053 | 2.57% | $562,053 | 0.49% | $97,671,316 |
Debt
The table below shows the amount of debt retired, issued, and outstanding in the district for each year.
| Debt | |||
|---|---|---|---|
| Fiscal Year |
Retired | Issued | Outstanding |
| Click [show] on the right to display the debt data for prior years. | |||
|---|---|---|---|
| 1995 | $0 | $17,100,000 | $17,100,000 |
| 1996 | $2,150,000 | $10,000,000 | $24,950,000 |
| 1997 | $2,700,000 | $9,800,000 | $32,050,000 |
| 1998 | $3,200,000 | $4,200,000 | $33,050,000 |
| 1999 | $3,150,000 | $5,200,000 | $35,100,000 |
| 2000 | $3,435,000 | $3,000,000 | $34,665,000 |
| 2001 | $4,015,000 | $12,000,000 | $42,650,000 |
| 2002 | $4,175,000 | $9,200,000 | $47,675,000 |
| 2003 | $10,925,000 | $14,120,000 | $50,870,000 |
| 2004 | $4,860,000 | $7,385,000 | $53,395,000 |
| 2005 | $5,450,000 | $9,100,000 | $57,045,000 |
| 2006 | $6,000,000 | $19,915,000 | $70,960,000 |
| 2007 | $7,105,000 | $14,825,000 | $65,455,000 |
| 2008 | $8,420,000 | $62,675,000 | $119,710,000 |
| 2009 | $13,280,000 | $25,000,000 | $131,430,000 |
| 2010 | $29,275,000 | $32,915,000 | $135,070,000 |
| 2011 | $13,185,000 | $13,200,000 | $135,085,000 |
| 2012 | $14,805,000 | $9,300,000 | $129,580,000 |
| 2013 | $18,865,000 | $13,355,000 | $124,070,000 |
| Avg. | $8,157,632 | $15,383,684 | $70,521,579 |
Teacher salaries
Rio Rancho Public Schools employed 1,032 K-12 teachers during the 2011-2012 school year.[1]
As of December 26, 2014, Rio Rancho did not provide detailed salary information for teachers on their website. However, the full negotiated agreement between the board of education and the Rio Rancho School Employees' Union is available.[8]
Schools in Rio Rancho
Enrollment
Rio Rancho served 17,225 students in 19 schools during the 2013-2014 school year.[9] The district does not publicly maintain historical enrollment data.
District schools
Rio Rancho Public Schools operates 19 schools listed below in alphabetical order:[10]
| Rio Rancho Public Schools |
|---|
| Cielo Azul Elementary |
| Colinas Del Norte Elementary |
| Eagle Ridge Middle |
| Enchanted Hills Elementary |
| Ernest Stapleton Elementary |
| Independence High School |
| Lincoln Middle |
| Maggie Cordova Elementary |
| Martin King Jr Elementary |
| Mountain View Middle |
| Puesta Del Sol Elementary |
| Rio Rancho Cyber Academy |
| Rio Rancho Elementary |
| Rio Rancho High |
| Rio Rancho Middle School |
| Sandia Vista Elementary |
| Shining Stars Preschool |
| V Sue Cleveland High |
| Vista Grande Elementary |
Contact information

Rio Rancho Public Schools
500 Laser Road
Rio Rancho, NM 87124
Phone: (505) 896-0667
Fax: (505) 896-0662
See also
| New Mexico | School Board Elections | News and Analysis |
|---|---|---|
 |
 | |
External links
- Rio Rancho Public Schools
- Sandoval County, New Mexico
- New Mexico Public Education Department
- New Mexico Association of Classroom Teachers
- Rio Rancho School Employees' Union
Footnotes
- ↑ 1.0 1.1 National Center for Education Statistics, "Rio Rancho Public Schools," accessed July 10, 2015
- ↑ 2.0 2.1 2.2 United States Census Bureau, "Sandoval County, New Mexico," accessed January 5, 2017
- ↑ Albuquerque Journal, "RRPS Board to renew superintendent’s contract," February 11, 2014
- ↑ Rio Rancho Public Schools, "Superintendent," accessed December 5, 2014
- ↑ 5.0 5.1 Rio Rancho Public Schools, "RRPS School Board," accessed December 5, 2014
- ↑ Rio Rancho Public Schools, "RRPS School Board Policies," accessed December 5, 2014
- ↑ United States Census Bureau, "Public School System Finances: Historical Data," accessed December 1, 2015
- ↑ Rio Rancho Public Schools, "Negotiated Agreement December 18, 2012-June 30, 2013," accessed December 26, 2014
- ↑ Rio Rancho Public Schools, "2013 District Profile," accessed December 26, 2014
- ↑ National Center for Education Statistics, "Rio Rancho Public Schools - Schools in this District," accessed December 26, 2014
| |||||
| |||||

