Mary Jo F. Randall


Mary Jo F. Randall was the Seat 4 representative on the Wauwatosa School Board in Wisconsin. She resigned from her position in November 2016.[1]
Elections
2014
| Party | Candidate | Vote % | Votes | |
|---|---|---|---|---|
| Nonpartisan | 98.8% | 3,913 | ||
| Nonpartisan | Write-in votes | 1.2% | 47 | |
| Total Votes | 3,960 | |||
| Source: City of Wauwatosa, "Official Election Results," accessed January 16, 2015 | ||||
About the district
- See also: Wauwatosa School District, Wisconsin
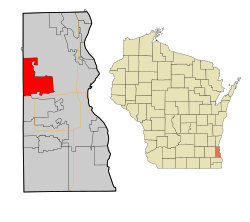
Wauwatosa School District is located in Milwaukee County, Wisconsin. The county seat is Milwaukee. Milwaukee County is home to 956,023 residents, according to the United States Census Bureau.[2]
Demographics
Higher education achievement
Milwaukee County outperformed the rest of Wisconsin in terms of higher education achievement in 2012. The United States Census Bureau found that 27.7 percent of Milwaukee County residents aged 25 years and older had attained a bachelor's degree compared to 26.4 percent for Wisconsin as a whole.[2]
Median household income
From 2008 through 2012, the median household income for Milwaukee County was $43,599. During that same time period, the median household income for Wisconsin was $52,627.[2]
Poverty rate
The poverty rate in Milwaukee County was 20.9 percent from 2008 through 2012. During that same time period, the poverty rate for the entire state was 12.5 percent.[2]
|
| |||||||||||||||||||||||||||||||||||||||||||||||||||||
Note: Percentages for race and ethnicity may add up to more than 100 percent because respondents may report more than one race and the Hispanic/Latino ethnicity may be selected in conjunction with any race. Read more about race and ethnicity in the census here.
Recent news
This section links to a Google news search for the term "Mary + Jo + Randall + Wauwatosa + School + District"
See also
- Wauwatosa School District, Wisconsin
- Hot tub Gatorade, turnout in Peoria and the Wisconsin state...
- Wisconsin school districts 2014 review
External links
Footnotes
