Help us improve in just 2 minutes—share your thoughts in our reader survey.
Pliny's Point on March 9, 2017
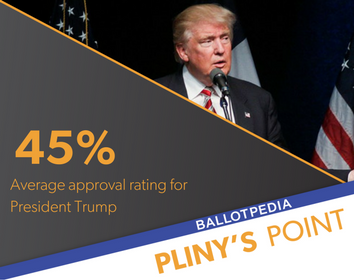
March 9, 2017: An average of recent polls shows a 45 percent approval rating for President Donald Trump, with individual poll results ranging from 39 to 50 percent approval. The average has not changed since the beginning of the week, despite the addition of new polling data from Gallup, Rasmussen Reports, The Economist/YouGov, Reuters/Ipsos, Politico/Morning Consult, and USA Today/Suffolk University. All of the polls included in todays average are listed below.
| Source | Date range | Sample size | Job approval rating | Margin of error (+/-) |
|---|---|---|---|---|
| Gallup[1] | 3/5 - 3/7 | 1,500 adults | 42% | 3% |
| Rasmussen Reports[2] | 3/5 - 3/7 | 1,500 likely voters | 49% | 2.5% |
| Economist/YouGov[3] | 3/6 - 3/7 | 1,359 registered voters | 44% | 3.4% |
| Reuters/Ipsos[4] | 3/3 - 3/7 | 1,662 adults | 48% | 2.7% |
| Politico/Morning Consult[5] | 3/2-3/6 | 1,992 registered voters | 50% | 2% |
| Quinnipiac University[6] | 3/2 - 3/6 | 1,283 registered voters | 41% | 2.7% |
| USA Today/Suffolk University[7] | 3/1 - 3/5 | 1,000 registered voters | 47% | 3% |
| Wall Street Journal/NBC[8] | 2/18 - 2/22 | 1,000 adults | 44% | 3.1% |
| CBS News[9] | 2/17 - 2/21 | 1,280 adults | 39% | 3% |
| Fox News[10] | 2/11 - 2/13 | 1,013 registered voters | 48% | 3% |
| Pew Research[11] | 2/7 - 2/12 | 1,503 adults | 39% | 2.9% |
A study by FiveThirtyEight found that variances in polls about President Trump's favorability stemmed primarily from the collection method. Polls of registered or likely voters tended to be more favorable to Trump than those that polled adults generally. Automated or online polls also resulted in more favorable rankings than those conducted with live phone calls. The data for these findings was taken from polls conducted between Feb. 1 and Feb. 19, 2017.[12] For more on the types of polling methods used in Ballotpedia's polling averages, see Pliny's Point polling methodology.
Methodology
For Ballotpedia's presidential approval, congressional approval, and direction of the country polling results, we take an average of the most recent polls on one or more of these topics conducted by 12 sources. Polls may be included in the average for up to 30 days, though this timeline may be adjusted to account for major news events as we attempt to balance the need for a larger sample of results with the need to remove outdated information. For a full description of our methodology and polling explanations, see: Ballotpedia's Polling Indexes.
What's in a name?
Pliny the Elder, a scholar from the Roman Empire, is most well known for writing the encyclopedic work Naturalis Historia, or “Natural History.” His extremely thorough work covered everything from botany to technology. Naturalis Historia, one of the largest Roman works that still exists from the first century A.D., became an example for future encyclopedic works through its formatting, references, and comprehensiveness.
Today, Ballotpedia works to preserve and expand knowledge, just like Pliny did hundreds of years ago. One of the features of Ballotpedia, the encyclopedia of American politics, was a daily statistic called Pliny’s Point. Each day, between January 20, 2017 and September 1, 2017, readers learned where Americans stood on the direction of the country, or their approval of elected officials.
Click here for more Pliny's Point articles.
See also
Ballotpedia daily polling averages:
Stay in the know:
- The Weekly Brew
- The Daily Brew
- You're Hired: Tracking the Trump Administration Transition, 2016-2017
- Policy issues under the Trump administration, 2017-2021
- 115th United States Congress
- Special elections to the 115th United States Congress (2017-2018)
Footnotes
- ↑ Gallup, "Trump Job Approval," accessed March 7, 2017
- ↑ Rasmussen Reports, "Trump Approval Index History," accessed March 8, 2017
- ↑ YouGov, "The Economist/YouGov Poll," March 6-7, 2017
- ↑ Ipsos, "Reuters/Ipsos Data: Core Political," March 8, 2017
- ↑ Morning Consult + Politico, "National Tracking Poll," March 2-6, 2017
- ↑ Quinnipiac University, "Trump Inches Up, But Still Has Negative Approval Rating, Quinnipiac University National Poll Finds," March 7, 2017
- ↑ USA Today, "USA TODAY Poll: Tweets and temperament are tripping up President Trump," March 7, 2017
- ↑ Wall Street Journal, "NBC News/Wall Street Journal Survey," February 18-22, 2017
- ↑ CBS News, Poll: Immigration is most important problem for Trump and Congress," February 23, 2017
- ↑ Fox News, "Fox News Poll," February 14, 2017
- ↑ Pew Research Center, "In First Month, Views of Trump Are Already Strongly Felt, Deeply Polarized," February 16, 2017
- ↑ FiveThirtyEight, "Why Polls Differ On Trump’s Popularity," February 20, 2017


