Pollution from energy use
This article does not receive scheduled updates. If you would like to help our coverage grow, consider donating to Ballotpedia. Contact our team to suggest an update.
| Energy in the 50 states |
|---|
Carbon monoxide, nitrogen dioxide and ozone are regulated under the National Ambient Air Quality Standards, which are federal standards limiting pollutants at certain concentrations.
Industries and motor vehicles emit carbon monoxide directly when they use energy. Nitrogen dioxide forms from the emissions of automobiles, power plants and other sources. Ground level ozone (also known as tropospheric ozone or smog) is not emitted but is the product of chemical reactions between nitrogen oxide and volatile organic chemicals. The EPA tracks these and other pollutants from monitoring sites across the United States. The data below shows nationwide and regional trends for carbon monoxide, nitrogen dioxide and ozone between 2000 and 2014. States with consistent climates and weather patterns were grouped together by the EPA to make up each region.[1][2]
The nationwide average concentration of carbon monoxide fell by 59.5 percent between 2000 and 2014, compared to a 28.9 percent decrease in nitrogen dioxide and a 17.7 percent decrease in ozone between 2000 and 2014.
National pollution trends
Carbon monoxide
Carbon monoxide (CO) is a colorless, odorless gas produced from combustion processes (e.g., when gasoline reacts rapidly with oxygen and releases exhaust); the majority of national CO emissions come from mobile sources like automobiles. CO can reduce the oxygen-carrying capacity of the blood and at very high levels can cause death. CO concentrations are measured in parts per million (ppm). Since 1994, federal law prohibits CO concentrations from exceeding 9 ppm more than once per year during any eight-hour period.[3][4]
The chart below compares the annual nationwide average concentration of carbon monoxide between 2000 and 2014. The data was collected by the U.S. Environmental Protection Agency (EPA) from 188 monitoring sites nationwide. In 2000, the nationwide average concentration of carbon monoxide was 3.57 ppm. In 2014, the nationwide average concentration of carbon monoxide was 1.44 ppm, a decrease of 59.5 percent from 2000.[5]
Nitrogen dioxide
Nitrogen dioxide (NO2) is one of a group of gasses known as nitrogen oxides (NOx). The U.S. Environmental Protection Agency (EPA) measures NO2 as a representative for the larger group of nitrogen oxides. NO2 forms from the emissions of cars, buses, trucks, power plants, and off-road equipment. It helps form ground-level ozone and fine particle pollution, and has been linked to respiratory problems. Since 1971, federal law prohibits NO2 concentrations from exceeding a daily one-hour average of 100 parts per billion (ppb) and an annual average of 53 parts per billion (ppb).[4][6]
The chart below compares the nationwide annual one-hour average concentration of nitrogen dioxide (NO2) between 2000 and 2014. The data was collected by the U.S. Environmental Protection Agency (EPA) from 167 monitoring sites nationwide. In 2000, the nationwide one-hour average concentration of NO2 was 57.53 ppb. In 2014, the nationwide one-hour average concentration of NO2 was 40.9 ppb, a decrease of 28.9 percent from 2000.[7]
Ozone
Ground-level ozone is created by chemical reactions between nitrogen oxides (NOx) and volatile organic compounds (VOCs) in sunlight. Major sources of NOx and VOCs include industrial facilities, electric utilities, automobiles, gasoline vapors, and chemical solvents. Ground-level ozone can produce health problems for children, the elderly, and asthmatics. Since 2008, federal law has prohibited ozone concentrations from exceeding a daily eight-hour average of 75 parts per billion (ppb). Beginning in 2025, federal law will prohibit ground-level ozone concentrations from exceeding a daily eight-hour average of 70 ppb.[4][8]
The chart below compares the daily eight-hour average concentration of ground-level ozone nationwide between 2000 and 2014. In the chart below, ozone concentrations are measured in parts per million (ppm), which can be converted to parts per billion (ppb). The data was collected by the U.S. Environmental Protection Agency (EPA) from 860 monitoring sites nationwide. In 2000, the daily eight-hour average concentration of ozone was 0.0812 ppm, or 81.2 ppb nationwide. In 2014, the daily eight-hour average concentration of ozone was 0.0668 ppm, or 66.8 ppb nationwide, a decrease of 17.7 percent since 2000.[9]
Carbon monoxide levels by region
Northeast and Southeast
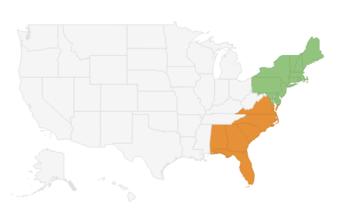
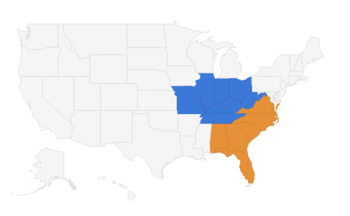
The chart below compares the annual average concentration of carbon monoxide in the Northeast and Southeast regions of the United States between 2000 and 2014. Each line represents the annual average of all the data collected from pollution monitoring sites in each region. In the Northeast, there were 32 monitoring sites throughout 11 states, compared to 22 monitoring sites throughout six states in the Southeast. In 2000, the average concentration of carbon monoxide was 2.7 ppm in the Northeast, compared to 3.91 ppm in the Southeast. In 2014, the average concentration of carbon monoxide was 1.2 ppm in the Northeast, a decrease of 61.1 percent from 2000, compared to 1.52 ppm in the Southeast, a decrease of 56.7 percent from 2000.[10]
Central and Upper Midwest
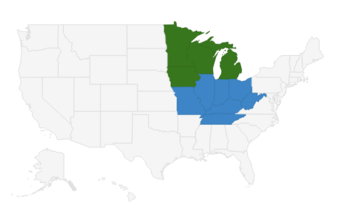
The chart below compares the annual average concentration of carbon monoxide (CO) in the Central and Upper Midwestern regions of the United States between 2000 and 2014. Carbon monoxide concentrations are measured in parts per million (ppm). Each line represents the annual average of all the data collected from pollution monitoring sites in each region. In the Central region, there were 25 monitoring sites throughout the seven states. In the Upper Midwest, there were seven monitoring sites throughout the four states. In 2000, the average concentration of carbon monoxide was 3.5 ppm in the Central region, compared to 2.67 ppm in the Upper Midwest. In 2014, the average concentration of carbon monoxide was 1.34 ppm in the Central region, a decrease of 61.6 percent from 2000, compared to 0.96 ppm in the Upper Midwest, a decrease of 64.1 percent from 2000.[10]
South and Southwest
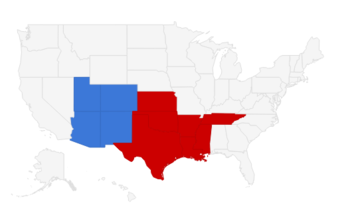
The chart below compares the annual average concentration of carbon monoxide (CO) in the Southern and Southwestern regions of the United States between 2000 and 2014. Carbon monoxide concentrations are measured in parts per million (ppm). Each line represents the annual average of all the data collected from pollution monitoring sites in each region. In the South, there were 18 monitoring sites throughout six states. In the Southwest, there were 24 monitoring sites throughout four states. In 2000, the average concentration of carbon monoxide was 3.84 ppm in the South, compared to 4.05 ppm in the Southwest. In 2014, the average concentration of carbon monoxide was 1.28 ppm in the South, a decrease of 66.6 percent from 2000, compared to 1.63 ppm in the Southwest, a decrease of 59.9 percent from 2000.[10]
Northwest and Northern Rockies/Plains
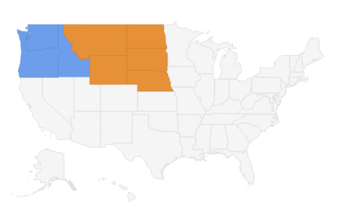
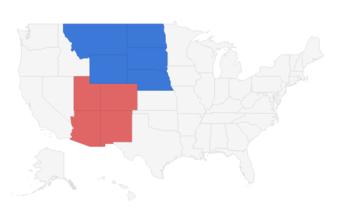
The chart below compares the annual average concentration of carbon monoxide in the Northern Rockies/Plains and Northwestern regions of the United States between 2000 and 2014. Each line represents the annual average of all the data collected from pollution monitoring sites in each region. In the Northwest, there were three monitoring sites throughout three states, compared to one monitoring site for five states in the Northern Rockies/Plains. In 2000, the average concentration of carbon monoxide was 3.93 ppm in the Northwest, compared to 5.5 ppm in the Northern Rockies/Plains. In 2014, the average concentration of carbon monoxide was 1.73 ppm in the Northwest, a decrease of 55.9 percent from 2000, compared to 2.6 ppm in the Northern Rockies/Plains, a decrease of 52.7 percent from 2000.[10]
West
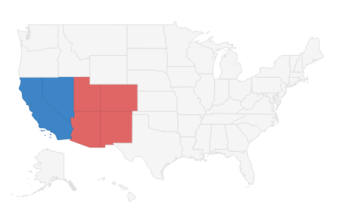
The chart below compares the annual average concentration of carbon monoxide in the Western and Southwestern regions of the United States between 2000 and 2014. Each line represents the annual average of all the data collected from pollution monitoring sites in each region. In the West, there were 56 monitoring sites throughout two states, compared to 24 monitoring sites throughout four states in the Southwest. In 2000, the average concentration of carbon monoxide was 3.69 ppm in the West, compared to 4.05 ppm in the Southwest. In 2014, the average concentration of carbon monoxide was 1.61 ppm in the West, a decrease of 56.5 percent from 2000, compared to 1.63 ppm in the Southwest, a decrease of 59.9 percent from 2000.[10]
Nitrogen dioxide levels by region
Note: Annual data on nitrogen dioxide levels in the Northwest and the Upper Midwest between 2000 and 2014 are unavailable.
Northeast and Southeast
The chart below compares the annual one-hour average concentration of nitrogen dioxide (NO2) in the Northeast and Southeast regions of the United States between 2000 and 2014. In the Northeast, there were 32 monitoring sites throughout 11 states, compared to 14 monitoring sites throughout six states in the Southeast. In 2000, the one-hour daily average concentration of NO2 was 61.31 ppb in the Northeast, compared to 57 ppb in the Southeast. In 2014, the one-hour daily average concentration of NO2 was 43.98 ppb in the Northeast, a decrease of 28.2 percent since 2000, compared to 38.36 ppb in the Southeast, a decrease of 32.6 percent since 2000.[11]
Central
The chart below compares the annual one-hour average concentration of nitrogen dioxide (NO2) in the Central and Southeastern regions of the United States between 2000 and 2014. In the Central region, there were 14 monitoring sites throughout seven states, and there were 14 monitoring sites throughout six states in the Southeast. In 2000, the one-hour daily average concentration of NO2 was 64.41 ppb in the Central region, compared to 57 ppb in the Southeast. In 2014, the one-hour daily average concentration of NO2 was 47.4 ppb in the Central region, a decrease of 26.4 percent since 2000, compared to 38.36 ppb in the Southeast, a decrease of 32.6 percent since 2000.[11]
South and Southwest
The chart below compares the annual one-hour average concentration of nitrogen dioxide (NO2) in the Southern and Southwestern regions of the United States between 2000 and 2014. In the South, there were 34 monitoring sites throughout six states, compared to 10 monitoring sites throughout four states in the Southwest. In 2000, the one-hour daily average concentration of NO2 was 50.24 ppb in the South, compared to 71.5 ppb in the Southwest. In 2014, the one-hour daily average concentration of NO2 was 36.77 ppb in the South, a decrease of 26.8 percent since 2000, compared to 49.35 ppb in the Southwest, a decrease of 30.9 percent since 2000.[11]
Northern Rockies/Plains
The chart below compares the annual one-hour average concentration of nitrogen dioxide (NO2) in the Northern Rockies/Plains and Southwestern regions of the United States between 2000 and 2014. In the Northern Rockies/Plains, there were five monitoring sites throughout five states, compared to 10 monitoring sites throughout four states in the Southwest. In 2000, the one-hour daily average concentration of NO2 was 28.2 ppb in the Northern Rockies/Plains, compared to 71.5 ppb in the Southwest. In 2014, the one-hour daily average concentration of NO2 was 23.56 ppb in the Northern Rockies/Plains, a decrease of 16.4 percent from 2000, compared to 49.35 ppb in the Southwest, a decrease of 30.9 percent from 2000.[11]
West
The chart below compares the annual one-hour average concentration of nitrogen dioxide (NO2) in the Western and Southwestern regions of the United States between 2000 and 2014. In the West, there were 56 monitoring sites throughout two states, compared to 10 monitoring sites throughout four states in the Southwest. In 2000, the one-hour daily average concentration of NO2 was 58.41 ppb in the West, compared to 71.5 ppb in the Southwest. In 2014, the one-hour daily average concentration of NO2 was 40.74 ppb in the West, a decrease of 30.2 percent from 2000, compared to 49.35 ppb in the Southwest, a decrease of 30.9 percent from 2000.[11]
Ozone levels by region
Note: Annual data on ground-level ozone in the Northwest between 2000 and 2014 are not available.
Northeast and Southeast
The chart below compares the daily eight-hour average concentration of ground-level ozone in the Northeast and Southeast regions of the United States between 2000 and 2014. In the chart below, ozone concentrations are measured in parts per million (ppm), which can be converted to parts per billion (ppb). In the Northeast, there were 133 monitoring sites throughout 11 states, compared to 153 monitoring sites throughout six states in the Southeast. In 2000, the daily eight-hour average concentration of ozone was 0.083 ppm, or 83 ppb in the Northeast, compared to 0.082 ppm, or 82 ppb in the Southeast. In 2014, the daily eight-hour average concentration of ozone was 0.066 ppm, or 66 ppb in the Northeast, a decrease of 19.5 percent since 2000, compared to 0.063 ppm, or 63 ppb in the Southeast, a decrease of 23.9 percent since 2000.[12]
Central and Upper Midwest
The chart below compares the daily eight-hour average concentration of ground-level ozone in the Central and Upper Midwestern regions of the United States between 2000 and 2014. In the chart below, ozone concentrations are measured in parts per million (ppm), which can be converted to parts per billion (ppb). In the Central region, there were 159 monitoring sites throughout seven states, compared to 61 monitoring sites throughout four states in the Upper Midwest. In 2000, the daily eight-hour average concentration of ozone was 0.0821 ppm, or 82.1 ppb in the Central region, compared to 0.0752 ppm, or 75.2 ppb in the Upper Midwest. In 2014, the daily eight-hour average concentration of ozone was 0.0651 ppm, or 65.1 ppb in the Central region, a decrease of 20.6 percent since 2000, compared to 0.0667 ppm, or 66.7 ppb in the Upper Midwest, a decrease of 11.2 percent since 2000.[12]
South and Southwest
The chart below compares the daily eight-hour average concentration of ground-level ozone in the Southern and Southwestern regions of the United States between 2000 and 2014. In the chart below, ozone concentrations are measured in parts per million (ppm), which can be converted to parts per billion (ppb). In the South, there were 110 monitoring sites throughout six states, compared to 63 monitoring sites throughout four states in the Southeast. In 2000, the daily eight-hour average concentration of ozone was 0.0873 ppm, or 87.3 ppb in the South, compared to 0.0773 ppm, or 77.3 ppb in the Southwest. In 2014, the daily eight-hour average concentration of ozone was 0.0661 ppm, or 66.1 ppb in the South, a decrease of 24.2 percent since 2000, compared to 0.0692 ppm, or 69.2 ppb in the Southwest, a decrease of 10.5 percent since 2000.[12]
Northwest and Northern Rockies/Plains
The chart below compares the daily eight-hour average concentration of ground-level ozone in the Northern Rockies/Plains and Northwestern regions of the United States between 2000 and 2014. In the chart below, ozone concentrations are measured in parts per million (ppm), which can be converted to parts per billion (ppb). In the Northern Rockies/Plains, there were 12 monitoring sites throughout five states, compared to 17 monitoring sites throughout three states in the Northwest. In 2000, the daily eight-hour average concentration of ozone was 0.0598 ppm, or 59.8 ppb in the Northern Rockies/Plains, compared to 0.0599 ppm, or 59.9 ppb in the Northwest. In 2014, the daily eight-hour average concentration of ozone was 0.0578 ppm, or 57.8 ppb in the Northern Rockies/Plains, a decrease of 3.3 percent from 2000, compared to 0.059 ppm, or 56.9 ppb in the Northwest, a decrease of 5 percent from 2000.[12]
West
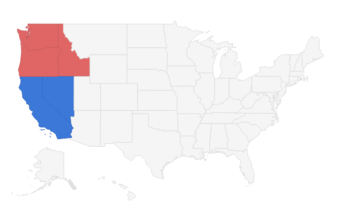
The chart below compares the daily eight-hour average concentration of ground-level ozone in the Western and Northwestern regions of the United States between 2000 and 2014. In the chart below, ozone concentrations are measured in parts per million (ppm), which can be converted to parts per billion (ppb). In the West, there were 152 monitoring sites throughout two states, compared to 17 monitoring sites throughout three states in the Northwest. In 2000, the daily eight-hour average concentration of ozone was 0.0817 ppm, or 81.7 ppb in the West, compared to 0.0559 ppm, or 59.9 ppb in the Northwest. In 2014, the daily eight-hour average concentration of ozone was 0.0745 ppm, or 74.5 ppb in the West, a decrease of 8.8 percent from 2000, compared to 0.0569 ppm, or 56.9 ppb in the Northwest, a decrease of 5 percent from 2000.[12]
See also
External links
- U.S. Environmental Protection Agency, "National, regional and local trends in carbon monoxide levels"
- U.S. Environmental Protection Agency, "National, regional and local trends in nitrogen dioxide levels"
- U.S. Environmental Protection Agency, "National, regional and local trends in ozone levels"
Footnotes
- ↑ U.S. Environmental Protection Agency, "Air Trends," accessed October 30, 2015
- ↑ U.S. Environmental Protection Agency, "Basic Information - Ozone," accessed January 1, 2016
- ↑ U.S. Environmental Protection Agency, "Carbon Monoxide," accessed October 26, 2015
- ↑ 4.0 4.1 4.2 U.S. Environmental Protection Agency, "National Ambient Air Quality Standards (NAAQS)," accessed October 26, 2015
- ↑ U.S. Environmental Protection Agency, "National Trends in CO Levels," accessed October 23, 2015
- ↑ U.S. Environmental Protection Agency, "Nitrogen dioxide," accessed October 26, 2015
- ↑ U.S. Environmental Protection Agency, "National Trends in Nitrogen Dioxide Levels," accessed October 26, 2015
- ↑ U.S. Environmental Protection Agency, "Ground Level Ozone," accessed October 26, 2015
- ↑ U.S. Environmental Protection Agency, "National Trends in Ozone Levels," accessed October 26, 2015
- ↑ 10.0 10.1 10.2 10.3 10.4 U.S. Environmental Protection Agency, "Regional Trends in CO Levels," accessed October 23, 2015
- ↑ 11.0 11.1 11.2 11.3 11.4 U.S. Environmental Protection Agency, "Regional Trends in Nitrogen Dioxide Levels," accessed October 23, 2015
- ↑ 12.0 12.1 12.2 12.3 12.4 U.S. Environmental Protection Agency, "Regional Trends in Ozone Levels," accessed October 26, 2015


