Become part of the movement for unbiased, accessible election information. Donate today.
Geoff Pallay/2012 state legislative elections preview
Geoff Pallay
Contact:
geoff.pallay@lucyburns.org
Biography:
Geoff Pallay
2010 Results
- 6,125 seats were up for election
- 20 chambers swung from Democratic to Republican
- 600+ seat swing for Republicans
| Partisan breakdown before the November 2010 Election | ||||
|---|---|---|---|---|
| Legislative chamber | ||||
| State senates | 23 | 18 | 1 | 1 |
| State houses | 29 | 15 | 1 | - |
| Totals: | 52 | 33 | 2 | 1 |
As a result of the election, Republicans picked up 20 legislative chambers while Democrats lost 20. Republicans won 53 total chambers on November 2, while Democrats won only 32. The following is a partisan breakdown of state legislatures after the November 2 election:
| Partisan breakdown after the November 2010 Election | ||||
|---|---|---|---|---|
| Legislative chamber | ||||
| State senates | 16 | 25 | 1 | 1 |
| State houses | 16 | 28 | 1 | 0 |
| Totals: | 32 | 53 | 2 | 1 |
| Incumbents defeated in 2010 legislative elections | |||
|---|---|---|---|
| Party | Senate | House | Total |
| Democratic | 89 | 403 | 492 |
| Republican | 5 | 10 | 15 |
| TOTALS | 94 | 413 | 507 |
| New Legislators after the 2010 legislative elections | |||
|---|---|---|---|
| Party | Senate | House | Total |
| Democratic | 110 | 357 | 467 |
| Republican | 278 | 988 | 1,266 |
| TOTALS | 388 | 1,345 | 1,733 |
| Open Seat Winners in 2010 legislative elections | |||
|---|---|---|---|
| Party | Senate | House | Total |
| Democratic | 108 | 341 | 449 |
| Republican | 191 | 538 | 729 |
| TOTALS | 299 | 879 | 1,178 |
| State legislative chambers where Democrats gained seats on November 2 | ||
|---|---|---|
| State | Chamber | Number of seats gained by Democrats |
| California | Assembly | + 2 |
| Delaware | House | + 2 |
| Hawaii | Senate | + 1 |
| Maryland | Senate | + 2 |
| Massachusetts | Senate | + 1 |
| Missouri | Senate | + 1 |
| West Virginia | Senate | + 1 |
Setting the stage
The big picture
- 86 chambers hold state legislative elections
- 6,015 seats up for election on November 6, 2012
- 4,783 incumbents running for re-election in 2012
- 21.2% of all seats up up for election do not have an incumbent running for the seat
- 248 state legislators are Term-limited
- We count 121 legislators who lost in 2010 that are trying to get back into state legislatures (about 25%)
- 24.6% of incumbents seeking re-election faced primary opposition
| Partisan Balance of Chambers with 2012 Elections | ||||||||
|---|---|---|---|---|---|---|---|---|
| Pre-election | Post-election | |||||||
| Legislative chamber | ||||||||
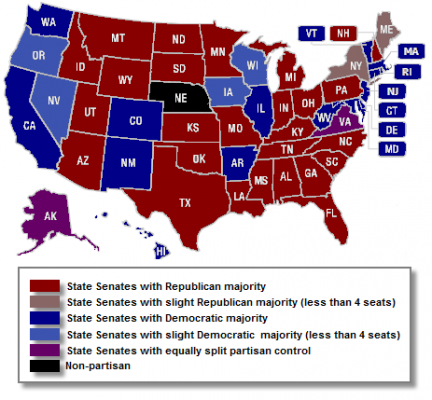
| State senates | 17 | 24 | 1 | 1 | 18 | 24 | 0 | 1 |
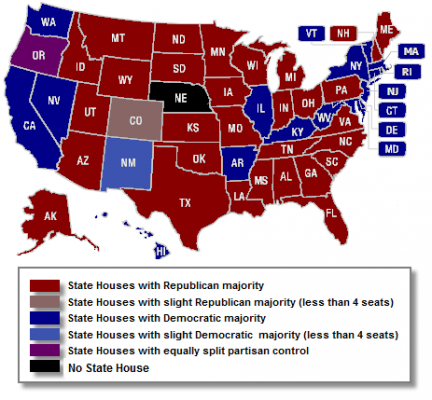
| State houses | 15 | 27 | 1 | 0 | 19 | 24 | 0 | 0 |
| Totals: | 32 | 51 | 2 | 1 | 37 | 48 | 0 | 1 |
| Partisan Balance of All 99 Chambers Before and After 2012 Elections | ||||||||
|---|---|---|---|---|---|---|---|---|
| Pre-election | Post-election | |||||||
| Legislative chamber | ||||||||
| State senates | 19 | 28 | 2 | 1 | 20 | 28 | 1 | 1 |
| State houses | 17 | 31 | 1 | 0 | 21 | 28 | 0 | 0 |
| Totals: | 36 | 59 | 3 | 1 | 41 | 56 | 1 | 1 |
Primary Results
A contested primary occurs when there is choice for voters and the possibility that at least one candidate can lose.
- 2,163 (18.4%) of primaries were contested
- 884 Democratic primaries were contested
- 1,182 Republican primaries were contested
- 97 Non-major party contested
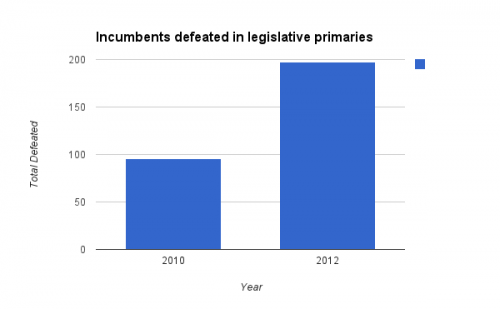
- 96 (8.4%) incumbents in contested primaries were defeated in 2010
- 197 (16.9%) incumbents in contested primaries were defeated in 2012
- 38 incumbent legislators were defeated by a fellow incumbent in a 2012 primary
Competitiveness Index
In 2010, we created a Competitiveness Index to know which states have the most competitive electoral environment and which states have the least competitive electoral environments in 2012. Three factors
- Does incumbent run for re-election?
- If so, does incumbent face a primary?
- Are there two major party candidates on the ballot?
Scored on a 0-100 scale, with 0 being least competitive and 100 being most competitive.
| Overall Comparison between years | |||||
|---|---|---|---|---|---|
| 2007 | 2009 | 2010 | 2011 | 2012 | |
| Competitiveness Index | 29.9 | 34.1 | 36.2 | 31.9 | 35.8 |
| % Open Seats | 13.7% | 10.5% | 18.6% | 18.2% | 21.2% |
| % Inc that did face primary | 22.7% | 18.6% | 22.7% | 20.1% | 24.6% |
| % Candidates that did face major party opp | 53.3% | 73.3% | 67.3% | 57.4% | 61.7% |
| Inc with at least one opponent | 57.8% | 70.2% | 74.0% | 49.9% | Pending |
Top 5 in 2010 vs. Top 5 in 2012
2010
- New Hampshire
- Michigan
- Arizona
- Nevada
- Maryland
2012
- California
- Michigan
- New Hampshire
- Idaho
- Nebraska
General Election
- 61.7% of all 6,015 races have two major party candidates in the general election
 231 Senate Democrats face no major party opposition in the general election
 268 Senate Republicans face no major party opposition in the general election
 897 House Democrats face no major party opposition in the general election
 905 House Republicans face no major party opposition in the general election
- First election after redistricting
- Kentucky Maine, Montana and Pennsylvania elections will use old redistricting maps
Possible flipping chambers
|
Senates
Currently Split
Democratic to Republican
Republican to Democratic
|
Houses
Currently Split
Democratic to Republican
Republican to Democratic
|
Maps
|
|
Questions to be answered
Everyone will be paying attention to presidential and congressional races, but we will gauge the down-ballot question: Will one party appear to have a better night in state legislatures?
- Notably, will any chambers flip party control?
- Will Republicans hold onto gains from 2010? Or will Democrats take back some of those swing districts lost two years ago?
- Which party performs better in open seats?
- How do incumbents perform in the general election?
- What impact did redistricting have on the outcomes?
Election night plan
Ballotpedia will be releasing results of the election that night and the following day, including:
- Chambers that change party control
- Number of incumbents defeated
- Number of open seats won by party
- Number of new legislators
- Trends or connections between other ticket elections and legislative results
- We'll also have results for Congressional, State Executive, State and Local Ballot Measures
Follow us on Twitter @ballotpedia


