ABC Unified School District, California
Ballotpedia provides comprehensive election coverage of the 100 largest cities in America by population as well as mayoral, city council, and district attorney election coverage in state capitals outside of the 100 largest cities. This school district is outside of that coverage scope and does not receive scheduled updates.
| ABC Unified School District |
|---|
| Cerritos, CA |
| District details |
| Superintendent: Dr. Mary Sieu |
| # of school board members: 7 |
| Website: Link |
The ABC Unified School District is a school district in California that is based in Cerritos, California. The district was the 68th-largest school district in the state in the 2014-2015 school year and served 20,998 students.[1]
About the district
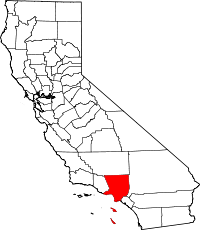
The ABC Unified School District is located in Los Angeles County in southwestern California. The county seat is Los Angeles. The county was home to an estimated 10,137,915 residents in 2016, according to the United States Census Bureau.[2]
Demographics
Los Angeles County underperformed compared to California as a whole in terms of higher education achievement between 2011 and 2015. The United States Census Bureau found that 30.3 percent of county residents aged 25 years and older had attained a bachelor's degree, compared to 31.4 percent of state residents. During the same time period, the median household income for Los Angeles County was $56,196, compared to $61,818 for the entire state. The percentage of people in poverty in the county was 16.7 percent, while it was 15.3 percent statewide.[2]
| Racial Demographics, 2016[2] | |||
|---|---|---|---|
| Race | Los Angeles County (%) | California (%) | |
| White | 71.0 | 72.7 | |
| Black or African American | 9.1 | 6.5 | |
| American Indian and Alaska Native | 1.5 | 1.7 | |
| Asian | 15.1 | 14.8 | |
| Native Hawaiian or Other Pacific Islander | 0.4 | 0.5 | |
| Two or more races | 3.0 | 3.8 | |
| Hispanic or Latino | 48.5 | 38.9 | |
Note: Percentages for race and ethnicity may add up to more than 100 percent because respondents may report more than one race and the Hispanic/Latino ethnicity may be selected in conjunction with any race. Read more about race and ethnicity in the census here.
Superintendent
| |
This information is updated as we become aware of changes. Please contact us with any updates. |
Dr. Mary Sieu is the superintendent for the ABC Unified School District. She has served in this role since 2012. Prior to her appointment as superintendent, Sieu served the district as a deputy superintendent, assistant superintendent of academic services, and director of special programs and services.[3][4]
School board elections
The ABC Unified School Board consists of seven members elected by district to four-year terms.[5]
| ABC Unified School Board | |||
|---|---|---|---|
| Member | Trustee Area | Assumed office | Term Ends |
| Letty Mendoza | 1 | 2015 | 2019 |
| Soo Y. Yoo | 2 | 2013 | 2022 |
| H. Ernie Nishii | 3 | 2017 | 2022 |
| Maynard Law | 4 | 2007 | 2019 |
| Sophia Tse | 5 | 2009 | 2019 |
| Olga Rios | 6 | 2017 | 2022 |
| Christopher Apodaca | 7 | 2015 | 2019 |
| |
This officeholder information was last updated on April 9, 2018. Please contact us with any updates. | |
Election dates
The ABC Unified School Board consists of seven members elected by district to four-year terms. Board member terms are staggered so that at least three members, but no more than four, are elected in November of each odd-numbered year. There are no primary elections.
Prior to the 2015 election, the district held school board elections at-large. They settled a California Voting Rights Act lawsuit by switching to by district elections after the 2013 school board election.
Three at-large seats were up for election on November 5, 2013, and the Trustee Area 1, 4, 5 and 7 seats were on the ballot on November 3, 2015. The Trustee Area 2, 3, and 6 seats were up for election on November 7, 2017.[6][7][8]
Budget
From 1993 to 2013, the ABC Unified School District had an average of $166,430,714 in revenue and $166,381,143 in expenditures, according to the United States Census Bureau's survey of school system finances. The district had a yearly average of $41,605,810 in outstanding debt. The district retired $921,286 of its debt and issued $2,906,381 in new debt each year on average.[9]
Revenue
The table below separates the district's revenue into the three sources identified by the agency: local, state, and federal.
| Revenue by Source | |||||||||||
|---|---|---|---|---|---|---|---|---|---|---|---|
| Fiscal Year |
Local | State | Federal | Revenue Total | |||||||
| Total | % of Revenue | Total | % of Revenue | Total | % of Revenue | ||||||
| Click [show] on the right to display the revenue data for prior years. | |||||||||||
|---|---|---|---|---|---|---|---|---|---|---|---|
| 1993 | $20,620,000 | 19.74% | $78,691,000 | 75.34% | $5,136,000 | 4.92% | $104,447,000 | ||||
| 1994 | $26,437,000 | 25.83% | $69,862,000 | 68.26% | $6,044,000 | 5.91% | $102,343,000 | ||||
| 1995 | $31,189,000 | 29.55% | $68,673,000 | 65.06% | $5,695,000 | 5.40% | $105,557,000 | ||||
| 1996 | $34,166,000 | 29.40% | $75,739,000 | 65.17% | $6,312,000 | 5.43% | $116,217,000 | ||||
| 1997 | $33,435,000 | 26.35% | $86,451,000 | 68.13% | $7,005,000 | 5.52% | $126,891,000 | ||||
| 1998 | $32,898,000 | 24.21% | $94,886,000 | 69.83% | $8,099,000 | 5.96% | $135,883,000 | ||||
| 1999 | $33,749,000 | 23.98% | $97,757,000 | 69.47% | $9,220,000 | 6.55% | $140,726,000 | ||||
| 2000 | $34,591,000 | 21.93% | $112,316,000 | 71.19% | $10,852,000 | 6.88% | $157,759,000 | ||||
| 2001 | $46,661,000 | 23.54% | $140,090,000 | 70.67% | $11,476,000 | 5.79% | $198,227,000 | ||||
| 2002 | $37,086,000 | 18.88% | $146,565,000 | 74.63% | $12,739,000 | 6.49% | $196,390,000 | ||||
| 2003 | $38,508,000 | 21.84% | $121,171,000 | 68.71% | $16,680,000 | 9.46% | $176,359,000 | ||||
| 2004 | $40,196,000 | 23.71% | $116,164,000 | 68.53% | $13,152,000 | 7.76% | $169,512,000 | ||||
| 2005 | $29,178,000 | 16.25% | $135,374,000 | 75.38% | $15,035,000 | 8.37% | $179,587,000 | ||||
| 2006 | $27,764,000 | 14.82% | $143,818,000 | 76.79% | $15,699,000 | 8.38% | $187,281,000 | ||||
| 2007 | $29,486,000 | 14.17% | $161,897,000 | 77.81% | $16,676,000 | 8.02% | $208,059,000 | ||||
| 2008 | $28,233,000 | 13.51% | $165,761,000 | 79.31% | $15,015,000 | 7.18% | $209,009,000 | ||||
| 2009 | $29,062,000 | 14.28% | $152,993,000 | 75.20% | $21,390,000 | 10.51% | $203,445,000 | ||||
| 2010 | $29,145,000 | 15.66% | $135,749,000 | 72.92% | $21,264,000 | 11.42% | $186,158,000 |
| 2011 | $31,568,000 | 15.87% | $143,412,000 | 72.08% | $23,970,000 | 12.05% | $198,950,000 |
| 2012 | $35,285,000 | 17.94% | $137,977,000 | 70.14% | $23,448,000 | 11.92% | $196,710,000 |
| 2013 | $42,279,000 | 21.62% | $132,337,000 | 67.68% | $20,919,000 | 10.70% | $195,535,000 |
| Avg. | $32,930,286 | 20.62% | $119,889,667 | 71.54% | $13,610,762 | 7.84% | $166,430,714 |
Expenditures
The table below separates the district's expenditures into five categories identified by the agency:
- Instruction: operation expenditures, state payments on behalf of the district for instruction and benefits, and retirement system transfers
- Support Services: support services, food services, and retirement system transfers for support service staff
- Capital Spending: capital outlay expenditures (i.e., construction, land or facilities purchases, and equipment purchases)
- Debt & Gov. Payments: payments to state and local governments and interest on school system debt
- Other: all other non-K-12 programs, except food services
| Expenditures by Category | |||||||||||
|---|---|---|---|---|---|---|---|---|---|---|---|
| Fiscal Year |
Instruction | Support Services | Capital Spending | Debt & Gov. Payments | Other | Budget Total | |||||
| Total | % of Budget | Total | % of Budget | Total | % of Budget | Total | % of Budget | Total | % of Budget | ||
| Click [show] on the right to display the expenditure data for prior years. | |||||||||||
|---|---|---|---|---|---|---|---|---|---|---|---|
| 1993 | $63,652,000 | 57.94% | $37,341,000 | 33.99% | $3,219,000 | 2.93% | $1,938,000 | 1.76% | $3,715,000 | 3.38% | $109,865,000 |
| 1994 | $58,699,000 | 57.93% | $32,872,000 | 32.44% | $2,538,000 | 2.50% | $2,248,000 | 2.22% | $4,965,000 | 4.90% | $101,322,000 |
| 1995 | $61,532,000 | 56.64% | $33,617,000 | 30.94% | $5,197,000 | 4.78% | $1,782,000 | 1.64% | $6,511,000 | 5.99% | $108,639,000 |
| 1996 | $61,543,000 | 53.43% | $37,803,000 | 32.82% | $5,537,000 | 4.81% | $145,000 | 0.13% | $10,165,000 | 8.82% | $115,193,000 |
| 1997 | $68,772,000 | 59.20% | $33,200,000 | 28.58% | $6,585,000 | 5.67% | $30,000 | 0.03% | $7,591,000 | 6.53% | $116,178,000 |
| 1998 | $75,019,000 | 59.19% | $35,957,000 | 28.37% | $7,009,000 | 5.53% | $17,000 | 0.01% | $8,739,000 | 6.90% | $126,741,000 |
| 1999 | $77,194,000 | 56.24% | $36,682,000 | 26.72% | $12,912,000 | 9.41% | $1,067,000 | 0.78% | $9,406,000 | 6.85% | $137,261,000 |
| 2000 | $85,789,000 | 53.18% | $45,983,000 | 28.50% | $19,091,000 | 11.83% | $1,014,000 | 0.63% | $9,449,000 | 5.86% | $161,326,000 |
| 2001 | $97,966,000 | 51.75% | $43,544,000 | 23.00% | $35,677,000 | 18.85% | $1,750,000 | 0.92% | $10,355,000 | 5.47% | $189,292,000 |
| 2002 | $99,179,000 | 48.08% | $53,203,000 | 25.79% | $39,905,000 | 19.34% | $1,847,000 | 0.90% | $12,157,000 | 5.89% | $206,291,000 |
| 2003 | $100,679,000 | 51.43% | $56,419,000 | 28.82% | $22,144,000 | 11.31% | $1,833,000 | 0.94% | $14,698,000 | 7.51% | $195,773,000 |
| 2004 | $97,195,000 | 55.08% | $56,947,000 | 32.27% | $7,293,000 | 4.13% | $1,696,000 | 0.96% | $13,342,000 | 7.56% | $176,473,000 |
| 2005 | $101,093,000 | 56.42% | $58,763,000 | 32.80% | $3,043,000 | 1.70% | $1,702,000 | 0.95% | $14,573,000 | 8.13% | $179,174,000 |
| 2006 | $100,814,000 | 54.42% | $61,504,000 | 33.20% | $5,564,000 | 3.00% | $1,673,000 | 0.90% | $15,711,000 | 8.48% | $185,266,000 |
| 2007 | $108,896,000 | 53.60% | $67,214,000 | 33.08% | $9,074,000 | 4.47% | $1,636,000 | 0.81% | $16,339,000 | 8.04% | $203,159,000 |
| 2008 | $113,068,000 | 54.30% | $69,430,000 | 33.34% | $7,144,000 | 3.43% | $1,591,000 | 0.76% | $17,001,000 | 8.16% | $208,234,000 |
| 2009 | $110,676,000 | 55.02% | $65,847,000 | 32.74% | $5,860,000 | 2.91% | $1,539,000 | 0.77% | $17,227,000 | 8.56% | $201,149,000 |
| 2010 | $104,649,000 | 55.70% | $64,071,000 | 34.10% | $3,016,000 | 1.61% | $1,475,000 | 0.79% | $14,671,000 | 7.81% | $187,882,000 |
| 2011 | $105,858,000 | 54.75% | $67,680,000 | 35.01% | $5,211,000 | 2.70% | $1,039,000 | 0.54% | $13,543,000 | 7.01% | $193,331,000 |
| 2012 | $107,499,000 | 54.51% | $67,936,000 | 34.45% | $8,741,000 | 4.43% | $1,055,000 | 0.53% | $11,981,000 | 6.08% | $197,212,000 |
| 2013 | $107,978,000 | 55.59% | $68,235,000 | 35.13% | $4,198,000 | 2.16% | $978,000 | 0.50% | $12,854,000 | 6.62% | $194,243,000 |
| Avg. | $90,845,238 | 54.97% | $52,107,048 | 31.24% | $10,426,571 | 6.07% | $1,335,952 | 0.83% | $11,666,333 | 6.88% | $166,381,143 |
Debt
The table below shows the amount of debt retired, issued, and outstanding in the district for each year.
| Debt | |||
|---|---|---|---|
| Fiscal Year |
Retired | Issued | Outstanding |
| Click [show] on the right to display the debt data for prior years. | |||
|---|---|---|---|
| 1993 | $460,000 | $0 | $1,210,000 |
| 1994 | $350,000 | $0 | $860,000 |
| 1995 | $215,000 | $0 | $645,000 |
| 1996 | $215,000 | $0 | $430,000 |
| 1997 | $215,000 | $0 | $215,000 |
| 1998 | $215,000 | $20,000,000 | $20,000,000 |
| 1999 | $740,000 | $0 | $19,260,000 |
| 2000 | $1,693,000 | $25,000,000 | $42,567,000 |
| 2001 | $1,274,000 | $14,000,000 | $55,293,000 |
| 2002 | $80,000 | $0 | $56,745,000 |
| 2003 | $180,000 | $0 | $58,962,000 |
| 2004 | $740,000 | $0 | $60,681,000 |
| 2005 | $645,000 | $0 | $60,036,000 |
| 2006 | $845,000 | $0 | $59,191,000 |
| 2007 | $1,045,000 | $0 | $58,146,000 |
| 2008 | $1,145,000 | $0 | $57,001,000 |
| 2009 | $1,345,000 | $2,034,000 | $65,660,000 |
| 2010 | $1,555,000 | $0 | $64,105,000 |
| 2011 | $1,805,000 | $0 | $65,028,000 |
| 2012 | $2,180,000 | $0 | $65,046,000 |
| 2013 | $2,405,000 | $0 | $62,641,000 |
| Avg. | $921,286 | $2,906,381 | $41,605,810 |
Teacher salaries
ABC Unified School District employs 868 certificated teachers. The following is the salary schedule for teachers based for the 2011-2012 school year.[10]
| ABCUSD FY11-12 Salary Schedule | ||||||
|---|---|---|---|---|---|---|
| Step | Bachelor's | Bachelor's +15 | Bachelor's +30 | Bachelor's +45/Master's | Bachelor's +60/Master's | Bachelor's +75/Master's |
| 1 | $45,000 | $46,120 | $47,272 | $48,455 | $49,667 | $50,909 |
| 2 | $45,445 | $46,581 | $47,746 | $48,939 | $50,162 | $51,417 |
| 3 | $47,036 | $48,212 | $49,418 | $50,652 | $51,918 | $53,217 |
| 4 | $48,682 | $49,898 | $51,147 | $52,425 | $53,736 | $55,080 |
| 5 | $50,385 | $51,646 | $52,936 | $54,259 | $55,616 | $57,007 |
| 6 | $52,150 | $53,452 | $54,789 | $56,159 | $57,564 | $59,002 |
| 7 | $53,975 | $55,324 | $56,706 | $58,125 | $59,578 | $61,067 |
| 8 | $53,975 | $57,261 | $58,692 | $60,160 | $61,663 | $63,204 |
| 9 | $53,975 | $57,261 | $60,747 | $62,264 | $63,821 | $65,417 |
| 10 | $53,975 | $57,261 | $62,872 | $64,444 | $66,055 | $67,706 |
| 11 | $53,975 | $57,261 | $65,072 | $66,700 | $68,366 | $70,076 |
| 12 | $53,975 | $57,261 | $67,350 | $69,035 | $70,759 | $72,528 |
| 13 | $53,975 | $57,261 | $67,350 | $69,035 | $73,237 | $75,068 |
| 14 | $53,975 | $57,261 | $67,350 | $69,035 | $73,237 | $75,068 |
| 15 | $53,975 | $57,261 | $67,350 | $71,105 | $75,434 | $77,319 |
| 16 | $53,975 | $57,261 | $67,350 | $71,105 | $75,434 | $77,319 |
| 17 | $53,975 | $57,261 | $67,350 | $71,105 | $75,434 | $77,319 |
| 18 | $53,975 | $57,261 | $67,350 | $73,237 | $77,697 | $79,639 |
| 19 | $53,975 | $57,261 | $67,350 | $73,237 | $77,697 | $79,639 |
| 20 | $53,975 | $57,261 | $67,350 | $73,237 | $77,697 | $79,639 |
| 21 | $53,975 | $57,261 | $67,350 | $75,436 | $80,027 | $82,028 |
| 22 | $53,975 | $57,261 | $67,350 | $75,436 | $80,027 | $82,028 |
| 23 | $53,975 | $57,261 | $67,350 | $75,436 | $80,027 | $82,028 |
| 24 | $53,975 | $57,261 | $67,350 | $77,699 | $82,428 | $84,488 |
| 25 | $53,975 | $57,261 | $67,350 | $77,699 | $82,428 | $84,488 |
| 26 | $53,975 | $57,261 | $67,350 | $77,699 | $82,428 | $84,488 |
| 27 | $53,975 | $57,261 | $67,350 | $80,029 | $84,902 | $87,025 |
| 28 | $53,975 | $57,261 | $67,350 | $80,029 | $84,902 | $87,025 |
| 29 | $53,975 | $57,261 | $67,350 | $80,029 | $84,902 | $87,025 |
| 30 | $53,975 | $57,261 | $67,350 | $82,430 | $87,447 | $90,000 |
District schools
The ABC Unified School District operates 29 schools listed below in alphabetical order:[11]
| ABC Unified School District | |
|---|---|
| Name | |
| ABC Adult School | |
| ABC Magnet Schools | |
| Aloha Health Medical Academy | |
| Artesia High School | |
| Bragg Elementary School | |
| Burbank Elementary School | |
| Carmenita Middle School | |
| Carver Elementary School | |
| Cerritos Elementary School | |
| Cerritos High School | |
| Elliot Elementary School | |
| Fedde International Studies Academy | |
| Furgeson Elementary School | |
| Gahr High School | |
| Gonsalves Elementary School | |
| Haskell Middle School | |
| Hawaiian Elementary School | |
| Juarez Elementary School | |
| Kennedy Elementary School | |
| Leal Elementary School | |
| Melbourne Elementary School | |
| Niemes Elementary School | |
| Nixon Elementary School | |
| Palms Elementary School | |
| Stowers Elementary School | |
| Tetzlaff Elementary School | |
| Tracy High School | |
| Willow Elementary School | |
| Wittman Elementary School | |
Academic performance
California STAR program
California's Standardized Testing and Reporting (STAR) program, which includes the California Standards Tests (CST), the California Modified Assessment (CMA), and the California Alternate Performance Assessment (CAPA), measures the achievement of California content standards for grades two through eleven. STAR results include English-language arts and mathematics in grades 2-11, science in grades 5 and 8-11, and history-social science in grades 8, 10, and 11. In high school, math and science tests reflect the course in which the student is enrolled. There are five benchmarks to indicate a student's proficiency on STAR. "Proficient" or "Advanced" indicates that a student is meeting or exceeding state standards, which is the desired achievement goal for all students.[12]
STAR- ABC Unified School District - Percent of Students Scoring at Proficient or Advanced[13]
| Subject | District | State |
|---|---|---|
| English-Language Arts | 67% | 54% |
| Mathematics | 63% | 50% |
| Science | 73% | 57% |
| History - Social Science | 61% | 48% |
Issues
Voting Rights Act lawsuit
In April 2013, a lawsuit was filed by three district residents under allegations that the ABC Unified School District School Board trustee system does not accurately represent the district as a whole. The current system of At Large trustees has five Asian trustees and two white trustees. All elected trustees are from the Cerritos area of the district, despite the district encompassing all or part of five cities. Former trustee applicant and plaintiff Olga Rios has sued in order to have the district change to a trustee district election system, where the district would be divided into seven geographic zones, with representatives elected from each of them. The 2002 California Voter Rights Act prohibits local governments from holding at-large elections if that system impairs the ability of minority groups to elect candidates of their choice.[14][15]
Contact information
![]()
ABC Unified School District
16700 Norwalk Blvd
Cerritos, CA 90703
562-926-5566
District website
See also
| California | School Board Elections | News and Analysis |
|---|---|---|
 |
 | |
External links
- ABC school district website
- School Finance Center, ABC Unified School District
- Los Angeles County website
- California Department of Education website
- California School Board Association website
Footnotes
- ↑ U.S. Department of Education, National Center for Education Statistics, "Common Core of Data, file ccd_lea_052_1414_w_0216161a, 2014-2015," accessed November 16, 2016
- ↑ 2.0 2.1 2.2 United States Census Bureau, "QuickFacts: Los Angeles County, California; California," accessed August 1, 2017
- ↑ ABC Unified, "Superintendent's Corner" accessed August 27, 2013"
- ↑ Hews Media Group, "Message to the Community from ABCUSD Superintendent Dr. Mary Sieu," September 7, 2012
- ↑ ABC Unified, "School Board Members" accessed August 27, 2013
- ↑ ABC Unified School District, "Bylaws of the Board" accessed July 29, 2015
- ↑ Los Angeles County Registrar-Recorder/County Clerk, "Local And Municipal Consolidated Elections - 11/3/2015," accessed July 29, 2015
- ↑ Press-Telegram, "ABC Unified settles lawsuit, agrees to school board elections by district," November 20, 2013
- ↑ United States Census Bureau, "Public School System Finances: Historical Data," accessed December 1, 2015
- ↑ ABC Unified School District, "ABC UNIFIED SCHOOL DISTRICT CERTIFICATED MEMBER'S SALARY SCHEDULE 2011-12" accessed August 27, 2013
- ↑ ABC Unified, "Schools" accessed August 27, 2013
- ↑ California Ed-Data, "Student Performance - 2011 ABC Unified School District" accessed August 27, 2013
- ↑ California Ed-Data, "Student Performance - 2011 ABC Unified School District" accessed August 27, 2013
- ↑ Press Telegram, "All-Cerritos school board: Lawsuit claims ABC Unified violates California Voting Rights Act" accessed August 27, 2013
- ↑ LA Times, "Suit seeks to change ABC Unified to trustee system" accessed August 27, 2013
| |||||

