Help us improve in just 2 minutes—share your thoughts in our reader survey.
Florence 1 Schools, South Carolina
Ballotpedia provides comprehensive election coverage of the 100 largest cities in America by population as well as mayoral, city council, and district attorney election coverage in state capitals outside of the 100 largest cities. This school district is outside of that coverage scope and does not receive scheduled updates.
| Florence Public School District One |
|---|
| Florence County, South Carolina |
| District details |
| Superintendent: Randy Bridges |
| # of school board members: 9 |
| Website: Link |
Florence Public School District One is a school district in South Carolina. The district was the 15th-largest school district in the state in the 2013–2014 school year and served 16,280 students.[1]
About the district

Florence Public School District One is located in Florence County, South Carolina. The city of the same name is the seat of county government. Florence County was home to 138,900 residents between 2010 and 2015, according to the United States Census Bureau.[2]
Demographics
Florence County underperformed in comparison to South Carolina as a whole in terms of higher education attainment between 2010 and 2014. The United States Census Bureau found that 21.5 percent of county residents aged 25 years and older had attained a bachelor's degree or higher compared to 25.3 percent for state residents. The median household income in the county was $42,321 compared to $45,033 for the state. County residents lived below the poverty level at a rate of 19.5 percent, while that rate was 16.6 percent for state residents.[2]
|
| |||||||||||||||||||||||||||||||||||||||||||||
Note: Percentages for race and ethnicity may add up to more than 100 percent because respondents may report more than one race and the Hispanic/Latino ethnicity may be selected in conjunction with any race. Read more about race and ethnicity in the census here.
Superintendent
| |
This information is updated as we become aware of changes. Please contact us with any updates. |
The superintendent of Florence Public School District One is Randy Bridges. He became the superintendent in January 2015.[4]
Past superintendents
Cleo F. Richardson Jr.
Dr. Cleo F. Richardson Jr. was the interim superintendent in 2014. He took over for retiring Superintendent Allie Brooks. In September 2014, the board voted unanimously to start the interview process with finalist Randy Bridges before offering a contract in October 2014.[5][6][7]
School board elections
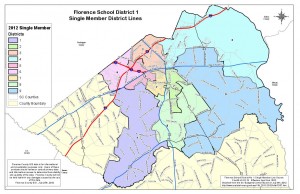
The Florence One Board of Education is a nonpartisan board that consists of nine members elected to four-year terms. They serve specific geographic districts.[8]
| Florence One Board of Education | ||
|---|---|---|
| Member | District | Term Ends |
| Barry Townsend | District 1 | 2020 |
| John Galloway | District 2 | 2020 |
| E. J. McIver | District 3 | 2022 |
| Alexis Pipkins Sr. | District 4 | 2020 |
| Artie Buxton | District 5 | 2020 |
| Trisha C. Caulder | District 6 | 2022 |
| Porter Stewart | District 7 | 2020 |
| Bryan Chapman | District 8 | 2022 |
| Davy Gregg | District 9 | 2022 |
| |
This officeholder information was last updated on January 13, 2021. Please contact us with any updates. | |
Election dates
Members of the board are elected to four-year terms on a staggered basis. Four seats were up for election on November 4, 2014, and five seats were up for election on November 8, 2016.
Public participation in board meetings
The board maintains the following policy regarding public participation in board meetings on its website:
| “ | A citizen wishing to address the Board may do so through Public Participation which is scheduled at each regular meeting.
|
” |
| —Florence Public School District's website, (2014) | ||
Budget
From 1993 to 2013, the Florence Public School District One had an average of $115,090,000 in revenue and $113,032,667 in expenditures, according to the United States Census Bureau's survey of school system finances. The district had a yearly average of $23,154,476 in outstanding debt. The district retired $6,685,429 of its debt and issued $7,293,476 in new debt each year on average.[11]
Revenue
The table below separates the district's revenue into the three sources identified by the agency: local, state, and federal.
| Revenue by Source | |||||||||||
|---|---|---|---|---|---|---|---|---|---|---|---|
| Fiscal Year |
Local | State | Federal | Revenue Total | |||||||
| Total | % of Revenue | Total | % of Revenue | Total | % of Revenue | ||||||
| Click [show] on the right to display the revenue data for prior years. | |||||||||||
|---|---|---|---|---|---|---|---|---|---|---|---|
| 1993 | $22,699,000 | 36.01% | $33,775,000 | 53.58% | $6,566,000 | 10.42% | $63,040,000 | ||||
| 1994 | $24,303,000 | 37.15% | $34,504,000 | 52.74% | $6,620,000 | 10.12% | $65,427,000 | ||||
| 1995 | $26,196,000 | 38.27% | $35,735,000 | 52.21% | $6,516,000 | 9.52% | $68,447,000 | ||||
| 1996 | $22,601,000 | 31.76% | $42,374,000 | 59.55% | $6,182,000 | 8.69% | $71,157,000 | ||||
| 1997 | $24,417,000 | 32.00% | $44,756,000 | 58.66% | $7,130,000 | 9.34% | $76,303,000 | ||||
| 1998 | $25,763,000 | 31.73% | $47,963,000 | 59.08% | $7,458,000 | 9.19% | $81,184,000 | ||||
| 1999 | $26,719,000 | 32.57% | $47,660,000 | 58.10% | $7,645,000 | 9.32% | $82,024,000 | ||||
| 2000 | $33,201,000 | 36.79% | $49,564,000 | 54.92% | $7,486,000 | 8.29% | $90,251,000 | ||||
| 2001 | $39,378,000 | 34.27% | $66,408,000 | 57.80% | $9,114,000 | 7.93% | $114,900,000 | ||||
| 2002 | $37,430,000 | 36.65% | $54,095,000 | 52.97% | $10,608,000 | 10.39% | $102,133,000 | ||||
| 2003 | $44,486,000 | 39.64% | $55,819,000 | 49.74% | $11,914,000 | 10.62% | $112,219,000 | ||||
| 2004 | $49,751,000 | 41.15% | $57,345,000 | 47.43% | $13,820,000 | 11.43% | $120,916,000 | ||||
| 2005 | $51,574,000 | 41.53% | $59,145,000 | 47.62% | $13,480,000 | 10.85% | $124,199,000 | ||||
| 2006 | $54,443,000 | 40.15% | $64,999,000 | 47.94% | $16,143,000 | 11.91% | $135,585,000 | ||||
| 2007 | $59,178,000 | 40.79% | $69,671,000 | 48.02% | $16,244,000 | 11.20% | $145,093,000 | ||||
| 2008 | $50,269,000 | 32.51% | $87,963,000 | 56.89% | $16,401,000 | 10.61% | $154,633,000 | ||||
| 2009 | $49,622,000 | 32.95% | $83,321,000 | 55.33% | $17,657,000 | 11.72% | $150,600,000 | ||||
| 2010 | $59,651,000 | 35.93% | $79,185,000 | 47.69% | $27,189,000 | 16.38% | $166,025,000 |
| 2011 | $59,906,000 | 37.32% | $77,473,000 | 48.26% | $23,152,000 | 14.42% | $160,531,000 |
| 2012 | $59,285,000 | 37.34% | $81,514,000 | 51.34% | $17,974,000 | 11.32% | $158,773,000 |
| 2013 | $69,180,000 | 39.88% | $88,409,000 | 50.97% | $15,861,000 | 9.14% | $173,450,000 |
| Avg. | $42,383,429 | 36.49% | $60,079,905 | 52.90% | $12,626,667 | 10.61% | $115,090,000 |
Expenditures
The table below separates the district's expenditures into five categories identified by the agency:
- Instruction: operation expenditures, state payments on behalf of the district for instruction and benefits, and retirement system transfers
- Support Services: support services, food services, and retirement system transfers for support service staff
- Capital Spending: capital outlay expenditures (i.e., construction, land or facilities purchases, and equipment purchases)
- Debt & Gov. Payments: payments to state and local governments and interest on school system debt
- Other: all other non-K-12 programs, except food services
| Expenditures by Category | |||||||||||
|---|---|---|---|---|---|---|---|---|---|---|---|
| Fiscal Year |
Instruction | Support Services | Capital Spending | Debt & Gov. Payments | Other | Budget Total | |||||
| Total | % of Budget | Total | % of Budget | Total | % of Budget | Total | % of Budget | Total | % of Budget | ||
| Click [show] on the right to display the expenditure data for prior years. | |||||||||||
|---|---|---|---|---|---|---|---|---|---|---|---|
| 1993 | $34,941,000 | 54.32% | $21,208,000 | 32.97% | $4,041,000 | 6.28% | $1,355,000 | 2.11% | $2,778,000 | 4.32% | $64,323,000 |
| 1994 | $35,330,000 | 50.40% | $22,742,000 | 32.44% | $8,254,000 | 11.77% | $1,668,000 | 2.38% | $2,105,000 | 3.00% | $70,099,000 |
| 1995 | $35,534,000 | 52.76% | $23,759,000 | 35.28% | $3,991,000 | 5.93% | $1,592,000 | 2.36% | $2,476,000 | 3.68% | $67,352,000 |
| 1996 | $38,517,000 | 52.19% | $23,642,000 | 32.03% | $7,865,000 | 10.66% | $1,544,000 | 2.09% | $2,238,000 | 3.03% | $73,806,000 |
| 1997 | $41,678,000 | 52.44% | $27,786,000 | 34.96% | $6,122,000 | 7.70% | $1,612,000 | 2.03% | $2,275,000 | 2.86% | $79,473,000 |
| 1998 | $42,758,000 | 51.43% | $28,530,000 | 34.32% | $7,677,000 | 9.23% | $1,679,000 | 2.02% | $2,489,000 | 2.99% | $83,133,000 |
| 1999 | $45,954,000 | 55.37% | $29,694,000 | 35.78% | $3,280,000 | 3.95% | $1,612,000 | 1.94% | $2,459,000 | 2.96% | $82,999,000 |
| 2000 | $49,077,000 | 55.90% | $31,495,000 | 35.87% | $2,944,000 | 3.35% | $1,450,000 | 1.65% | $2,832,000 | 3.23% | $87,798,000 |
| 2001 | $53,100,000 | 50.16% | $33,441,000 | 31.59% | $14,737,000 | 13.92% | $1,615,000 | 1.53% | $2,960,000 | 2.80% | $105,853,000 |
| 2002 | $56,480,000 | 52.37% | $34,960,000 | 32.41% | $10,406,000 | 9.65% | $1,255,000 | 1.16% | $4,754,000 | 4.41% | $107,855,000 |
| 2003 | $55,815,000 | 56.13% | $34,431,000 | 34.63% | $3,975,000 | 4.00% | $1,264,000 | 1.27% | $3,949,000 | 3.97% | $99,434,000 |
| 2004 | $60,568,000 | 56.03% | $36,272,000 | 33.55% | $5,525,000 | 5.11% | $2,395,000 | 2.22% | $3,348,000 | 3.10% | $108,108,000 |
| 2005 | $64,047,000 | 54.90% | $40,526,000 | 34.74% | $6,763,000 | 5.80% | $2,298,000 | 1.97% | $3,026,000 | 2.59% | $116,660,000 |
| 2006 | $72,073,000 | 55.83% | $47,074,000 | 36.47% | $5,776,000 | 4.47% | $1,211,000 | 0.94% | $2,956,000 | 2.29% | $129,090,000 |
| 2007 | $77,216,000 | 54.98% | $55,452,000 | 39.48% | $3,933,000 | 2.80% | $1,670,000 | 1.19% | $2,183,000 | 1.55% | $140,454,000 |
| 2008 | $82,337,000 | 56.29% | $57,151,000 | 39.07% | $4,029,000 | 2.75% | $778,000 | 0.53% | $1,977,000 | 1.35% | $146,272,000 |
| 2009 | $84,678,000 | 54.53% | $59,427,000 | 38.27% | $8,445,000 | 5.44% | $1,178,000 | 0.76% | $1,564,000 | 1.01% | $155,292,000 |
| 2010 | $86,278,000 | 55.43% | $61,099,000 | 39.26% | $5,570,000 | 3.58% | $1,075,000 | 0.69% | $1,623,000 | 1.04% | $155,645,000 |
| 2011 | $81,855,000 | 53.24% | $58,496,000 | 38.05% | $11,171,000 | 7.27% | $914,000 | 0.59% | $1,318,000 | 0.86% | $153,754,000 |
| 2012 | $80,690,000 | 48.95% | $59,856,000 | 36.31% | $22,178,000 | 13.45% | $921,000 | 0.56% | $1,209,000 | 0.73% | $164,854,000 |
| 2013 | $85,699,000 | 47.23% | $62,864,000 | 34.65% | $29,801,000 | 16.43% | $1,736,000 | 0.96% | $1,332,000 | 0.73% | $181,432,000 |
| Avg. | $60,220,238 | 53.37% | $40,471,667 | 35.34% | $8,403,952 | 7.31% | $1,467,714 | 1.47% | $2,469,095 | 2.50% | $113,032,667 |
Debt
The table below shows the amount of debt retired, issued, and outstanding in the district for each year.
| Debt | |||
|---|---|---|---|
| Fiscal Year |
Retired | Issued | Outstanding |
| Click [show] on the right to display the debt data for prior years. | |||
|---|---|---|---|
| 1993 | $2,075,000 | $13,375,000 | $27,195,000 |
| 1994 | $1,940,000 | $0 | $25,255,000 |
| 1995 | $2,056,000 | $0 | $23,199,000 |
| 1996 | $1,735,000 | $6,000,000 | $27,464,000 |
| 1997 | $1,810,000 | $0 | $25,654,000 |
| 1998 | $2,350,000 | $5,518,000 | $28,822,000 |
| 1999 | $2,655,000 | $0 | $26,167,000 |
| 2000 | $2,875,000 | $0 | $23,292,000 |
| 2001 | $3,175,000 | $2,510,000 | $22,627,000 |
| 2002 | $3,973,000 | $5,807,000 | $24,461,000 |
| 2003 | $7,290,000 | $11,819,000 | $28,990,000 |
| 2004 | $4,815,000 | $7,805,000 | $31,980,000 |
| 2005 | $12,814,000 | $7,887,000 | $27,053,000 |
| 2006 | $5,225,000 | $0 | $21,828,000 |
| 2007 | $5,050,000 | $0 | $16,778,000 |
| 2008 | $6,700,000 | $2,700,000 | $12,778,000 |
| 2009 | $7,327,000 | $3,412,000 | $8,863,000 |
| 2010 | $11,757,000 | $10,487,000 | $7,593,000 |
| 2011 | $11,690,000 | $22,971,000 | $18,874,000 |
| 2012 | $11,500,000 | $21,334,000 | $28,708,000 |
| 2013 | $31,582,000 | $31,538,000 | $28,663,000 |
| Avg. | $6,685,429 | $7,293,476 | $23,154,476 |
Teacher salaries
Florence One teacher salaries are based on years of experience and educational attainment. A teacher can earn higher salaries by pursuing advanced degrees. The following table details the salary schedule for the 2014-2015 school year.[12]
| Salary structure | |||||
|---|---|---|---|---|---|
| Degree level | Minimum salary ($) | Maximum salary ($) | |||
| Bachelor's degree | 31,595 | 50,269 | |||
| Bachelor's degree + 18 hours | 32,896 | 52,240 | |||
| Master's degree | 36,134 | 56,825 | |||
| Master's degree + 30 hours | 39,156 | 60,164 | |||
| Doctorate | 42,091 | 69,283 | |||
Schools in Florence Public School District One
Enrollment
The district served 15,367 students during the 2011-2012 school year. The district experienced a 0.8 percent increase in enrollment between 2010 and 2012. The following chart details enrollment in the district between 2010 and 2012:[13]
| Total enrollment | ||
|---|---|---|
| Year | Enrollment | Year-to-year change (%) |
| 2009-2010 | 15,238 | N/A |
| 2010-2011 | 15,349 | 0.7 |
| 2011-2012 | 15,367 | 0.1 |
District schools
Florence Public School District One operates 26 schools listed below in alphabetical order:[14]
| Florence Public School District One Schools |
|---|
| School Name |
| Alfred Rush Academy |
| Beck Learning Center |
| Briggs Elementary School |
| Carver Elementary School |
| Delmae Elementary School |
| Dewey-Carter Elementary School |
| Florence Career Center |
| Greenwood Elementary School |
| Henry L. Sneed Middle School |
| Henry Timrod Elementary School |
| John W. Moore Middle School |
| Lucy T. Davis Elementary School |
| McLaurin Elementary School |
| North Vista Elementary School |
| Palmetto Youth Academy Charter |
| Poynor Center |
| Royall Elementary School |
| Savannah Grove Elementary School |
| South Florence High School |
| Southside Middle School |
| Theodore Lester Elementary School |
| Wallace Gregg Elementary School |
| West Florence High School |
| Williams Middle School |
| Wilson High School |
Academic performance
The South Carolina Department of Education administers annual tests to district students called the South Carolina Palmetto Assessment of State Standards (SC PASS). These tests assess the proficiency of district students in five academic subjects including reading, math, science, social studies and writing. The following table details the percentage of students who met and exceeded proficiency levels on the SC PASS during the 2013-2014 school year:[15]
| SC PASS Scores, 2013-2014[16] | ||
|---|---|---|
| Subject | Meets standard (%) | Exceeds standard (%) |
| Reading | 74.4 | 39.8 |
| Math | 71.3 | 30.2 |
| Science | 73.0 | 27.9 |
| Social Studies | 76.9 | 34.7 |
| Writing | 77.8 | 36.4 |
Issues
2014 state report cards
A new round of state report cards released on November 14, 2014, show an improving graduation rate, with more than 80 percent of South Carolina students able to call themselves graduates. The data also rated 49 out of 82 school districts as either "good" or "excellent," which is a significant improvement from 2009 when only one South Carolina school district achieved an "excellent" rating. In Florence County, Florence Public School District One proved to be one of the county's highest performing districts, receiving an "excellent" rating for the third consecutive year. Three out of the six other districts in Florence County received either an "average" or "below average" rating. According to Dana Yow, a spokeswoman for the South Carolina Education Oversight Committee, South Carolina school districts "have done a really good job of focusing on that end result." The data used to compile the report cards is taken from student achievement and other related factors; graduation rate makes up 40 percent of the overall score.[17]
Contact information
![]()
Florence Public School District One
319 South Dargan Street
Florence, SC 29506
Phone: (843) 669-4141
See also
- South Carolina
- South Carolina school districts
- List of school districts in South Carolina
- Florence Public School District One elections (2014)
- School board elections portal
External links
- Florence Public School District One
- South Carolina Department of Education
- South Carolina School Boards Association
- Florence County, South Carolina
- Florence, South Carolina
Footnotes
- ↑ National Center for Education Statistics, "ELSI Table Generator," accessed November 16, 2015
- ↑ 2.0 2.1 2.2 United States Census Bureau, "Florence County, South Carolina," accessed September 21, 2016
- ↑ South Carolina State Election Commission, "Election Results," accessed August 19, 2014
- ↑ Florence Public School District One, "Superintendent's Office," accessed July 19, 2016
- ↑ Morning News, "Florence 1 identifies superintendent candidate," September 11, 2014
- ↑ Morning News, "Florence 1 names Richardson interim superintendent," May 29, 2014
- ↑ Carolina Live.com, "Florence school board offers contract to new superintendent," October 10, 2014
- ↑ Florence Public School District One, "Meet the Board," accessed January 13, 2021
- ↑ Note: This text is quoted verbatim from the original source. Any inconsistencies are attributable to the original source.
- ↑ Florence Public School District One, "Public Participation at Board Meetings," accessed November 21, 2014
- ↑ United States Census Bureau, "Public School System Finances: Historical Data," accessed December 1, 2015
- ↑ Florence Public School District One, "2014-2015 Teacher Salary Schedule," accessed November 21, 2014
- ↑ South Carolina State Department of Education, "Average Daily Membership and Attendance," accessed November 19, 2014
- ↑ South Carolina Department of Education, "Florence Public School District One," accessed November 20, 2014
- ↑ South Carolina State Department of Education, "Report Cards," accessed November 19, 2014
- ↑ Cite error: Invalid
<ref>tag; no text was provided for refs namedscores - ↑ SC Now, "On-time graduation rate increases again in SC," November 14, 2014
| |||||
 |
State of South Carolina Columbia (capital) |
|---|---|
| Elections |
What's on my ballot? | Elections in 2025 | How to vote | How to run for office | Ballot measures |
| Government |
Who represents me? | U.S. President | U.S. Congress | Federal courts | State executives | State legislature | State and local courts | Counties | Cities | School districts | Public policy |