Become part of the movement for unbiased, accessible election information. Donate today.
Alpine School District, Utah
| Alpine School District |
|---|
| Utah County, Utah |
| District details |
| Superintendent: Samuel Y. Jarman |
| # of school board members: 7 |
| Website: Link |
Alpine School District is a school district in Utah that served 72,452 students in 83 schools during the 2012-2013 school year.[1] This district was the largest by enrollment in the state of Utah.
About the district
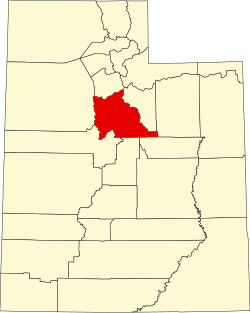
Alpine School District is located in Utah County, Utah. The county seat is Provo. Utah County was home to 551,926 residents in 2013, according to the United States Census Bureau.[2]
Demographics
Utah County overperformed in comparison to the rest of Utah in terms of higher education achievement and median household income in 2013. The United States Census Bureau found that 36.5 percent of Utah County residents aged 25 years and older had attained a bachelor's degree compared to 30.3 percent for Utah as a whole. The median household income in Utah County was $60,196 compared to $58,821 for the state of Utah. The poverty rate in Utah County was 14.0 percent compared to 12.7 percent for the entire state.[2]
|
| |||||||||||||||||||||||||||||||||||||||||||||||||||
Note: Percentages for race and ethnicity may add up to more than 100 percent because respondents may report more than one race and the Hispanic/Latino ethnicity may be selected in conjunction with any race. Read more about race and ethnicity in the census here.
Superintendent
The superintendent of Alpine School District is Samuel Jarman, who was appointed to the position in May 2015. He previously served an as educator, assistant principal, principal and assistant superintendent.[4]
School board
Alpine School District is overseen by a seven-member board. Each member is elected by specific geographic district and serves a four-year term.[5]
| Alpine Board of Education | ||
|---|---|---|
| Member | District # | Term ends |
| Paula Hill | 1 | 2018 |
| Wendy K. Hart | 2 | 2018 |
| John C. Burton | 3 | 2018 |
| Brian Halladay | 4 | 2016 |
| JoDee C. Sundberg | 5 | 2018 |
| S. Scott Carlson | 6 | 2016 |
| Deborah Taylor | 7 | 2016 |
School board elections
- See also: Alpine School District elections (2014)
Members of the Alpine Board of Education are elected to four-year terms. Four seats were up for election on November 4, 2014. Three seats were up for election on November 8, 2016.
Public participation in board meetings
The Alpine Board of Education does not publish a policy regarding public participation in board meetings on its website.
Budget
From 1993 to 2013, the Alpine School District had an average of $293,299,143 in revenue and $303,146,429 in expenditures, according to the United States Census Bureau's survey of school system finances. The district had a yearly average of $246,632,095 in outstanding debt. The district retired $28,204,667 of its debt and issued $44,964,524 in new debt each year on average.[6]
Revenue
The table below separates the district's revenue into the three sources identified by the agency: local, state, and federal.
| Revenue by Source | |||||||||||
|---|---|---|---|---|---|---|---|---|---|---|---|
| Fiscal Year |
Local | State | Federal | Revenue Total | |||||||
| Total | % of Revenue | Total | % of Revenue | Total | % of Revenue | ||||||
| Click [show] on the right to display the revenue data for prior years. | |||||||||||
|---|---|---|---|---|---|---|---|---|---|---|---|
| 1993 | $42,165,000 | 31.01% | $86,204,000 | 63.40% | $7,589,000 | 5.58% | $135,958,000 | ||||
| 1994 | $42,029,000 | 29.32% | $93,257,000 | 65.06% | $8,061,000 | 5.62% | $143,347,000 | ||||
| 1995 | $65,715,000 | 37.81% | $100,157,000 | 57.62% | $7,951,000 | 4.57% | $173,823,000 | ||||
| 1996 | $53,254,000 | 30.82% | $111,114,000 | 64.31% | $8,404,000 | 4.86% | $172,772,000 | ||||
| 1997 | $45,096,000 | 25.09% | $125,484,000 | 69.83% | $9,130,000 | 5.08% | $179,710,000 | ||||
| 1998 | $44,938,000 | 23.91% | $132,667,000 | 70.58% | $10,357,000 | 5.51% | $187,962,000 | ||||
| 1999 | $55,526,000 | 26.36% | $144,337,000 | 68.51% | $10,817,000 | 5.13% | $210,680,000 | ||||
| 2000 | $62,584,000 | 27.99% | $149,584,000 | 66.91% | $11,398,000 | 5.10% | $223,566,000 | ||||
| 2001 | $65,279,000 | 27.53% | $158,656,000 | 66.90% | $13,208,000 | 5.57% | $237,143,000 | ||||
| 2002 | $69,220,000 | 27.04% | $173,545,000 | 67.78% | $13,271,000 | 5.18% | $256,036,000 | ||||
| 2003 | $73,020,000 | 28.47% | $169,056,000 | 65.92% | $14,385,000 | 5.61% | $256,461,000 | ||||
| 2004 | $85,226,000 | 30.60% | $174,194,000 | 62.54% | $19,131,000 | 6.87% | $278,551,000 | ||||
| 2005 | $93,079,000 | 30.50% | $186,246,000 | 61.03% | $25,825,000 | 8.46% | $305,150,000 | ||||
| 2006 | $106,046,000 | 31.34% | $201,345,000 | 59.50% | $30,990,000 | 9.16% | $338,381,000 | ||||
| 2007 | $109,496,000 | 30.49% | $218,534,000 | 60.84% | $31,146,000 | 8.67% | $359,176,000 | ||||
| 2008 | $136,551,000 | 31.86% | $256,479,000 | 59.84% | $35,566,000 | 8.30% | $428,596,000 | ||||
| 2009 | $140,418,000 | 31.74% | $248,148,000 | 56.08% | $53,892,000 | 12.18% | $442,458,000 | ||||
| 2010 | $141,715,000 | 31.77% | $250,771,000 | 56.23% | $53,525,000 | 12.00% | $446,011,000 |
| 2011 | $149,485,000 | 34.24% | $238,928,000 | 54.72% | $48,206,000 | 11.04% | $436,619,000 |
| 2012 | $154,000,000 | 32.53% | $273,197,000 | 57.71% | $46,224,000 | 9.76% | $473,421,000 |
| 2013 | $150,344,000 | 31.75% | $282,417,000 | 59.65% | $40,700,000 | 8.60% | $473,461,000 |
| Avg. | $89,770,762 | 30.10% | $179,729,524 | 62.62% | $23,798,857 | 7.28% | $293,299,143 |
Expenditures
The table below separates the district's expenditures into five categories identified by the agency:
- Instruction: operation expenditures, state payments on behalf of the district for instruction and benefits, and retirement system transfers
- Support Services: support services, food services, and retirement system transfers for support service staff
- Capital Spending: capital outlay expenditures (i.e., construction, land or facilities purchases, and equipment purchases)
- Debt & Gov. Payments: payments to state and local governments and interest on school system debt
- Other: all other non-K-12 programs, except food services
| Expenditures by Category | |||||||||||
|---|---|---|---|---|---|---|---|---|---|---|---|
| Fiscal Year |
Instruction | Support Services | Capital Spending | Debt & Gov. Payments | Other | Budget Total | |||||
| Total | % of Budget | Total | % of Budget | Total | % of Budget | Total | % of Budget | Total | % of Budget | ||
| Click [show] on the right to display the expenditure data for prior years. | |||||||||||
|---|---|---|---|---|---|---|---|---|---|---|---|
| 1993 | $71,237,000 | 48.34% | $45,542,000 | 30.91% | $22,772,000 | 15.45% | $3,876,000 | 2.63% | $3,929,000 | 2.67% | $147,356,000 |
| 1994 | $85,649,000 | 57.89% | $38,700,000 | 26.16% | $16,003,000 | 10.82% | $4,085,000 | 2.76% | $3,517,000 | 2.38% | $147,954,000 |
| 1995 | $92,495,000 | 54.43% | $41,702,000 | 24.54% | $26,535,000 | 15.61% | $6,024,000 | 3.54% | $3,182,000 | 1.87% | $169,938,000 |
| 1996 | $100,194,000 | 49.85% | $43,872,000 | 21.83% | $46,702,000 | 23.24% | $7,193,000 | 3.58% | $3,014,000 | 1.50% | $200,975,000 |
| 1997 | $101,149,000 | 51.56% | $46,402,000 | 23.65% | $37,398,000 | 19.06% | $7,946,000 | 4.05% | $3,277,000 | 1.67% | $196,172,000 |
| 1998 | $109,493,000 | 56.32% | $49,759,000 | 25.60% | $24,121,000 | 12.41% | $7,624,000 | 3.92% | $3,404,000 | 1.75% | $194,401,000 |
| 1999 | $116,797,000 | 59.42% | $54,395,000 | 27.67% | $14,104,000 | 7.18% | $7,540,000 | 3.84% | $3,723,000 | 1.89% | $196,559,000 |
| 2000 | $121,947,000 | 58.78% | $57,611,000 | 27.77% | $16,006,000 | 7.71% | $8,225,000 | 3.96% | $3,680,000 | 1.77% | $207,469,000 |
| 2001 | $130,182,000 | 57.83% | $63,803,000 | 28.34% | $18,364,000 | 8.16% | $8,845,000 | 3.93% | $3,905,000 | 1.73% | $225,099,000 |
| 2002 | $143,400,000 | 53.56% | $68,894,000 | 25.73% | $42,083,000 | 15.72% | $9,466,000 | 3.54% | $3,909,000 | 1.46% | $267,752,000 |
| 2003 | $144,390,000 | 46.07% | $72,533,000 | 23.14% | $81,902,000 | 26.13% | $10,554,000 | 3.37% | $4,039,000 | 1.29% | $313,418,000 |
| 2004 | $152,445,000 | 46.95% | $76,666,000 | 23.61% | $79,094,000 | 24.36% | $12,403,000 | 3.82% | $4,106,000 | 1.26% | $324,714,000 |
| 2005 | $165,271,000 | 54.49% | $79,571,000 | 26.23% | $40,684,000 | 13.41% | $12,750,000 | 4.20% | $5,026,000 | 1.66% | $303,302,000 |
| 2006 | $182,557,000 | 53.26% | $89,087,000 | 25.99% | $51,762,000 | 15.10% | $13,592,000 | 3.97% | $5,745,000 | 1.68% | $342,743,000 |
| 2007 | $190,210,000 | 57.24% | $93,830,000 | 28.24% | $30,006,000 | 9.03% | $12,387,000 | 3.73% | $5,866,000 | 1.77% | $332,299,000 |
| 2008 | $224,898,000 | 51.35% | $101,420,000 | 23.16% | $90,311,000 | 20.62% | $14,593,000 | 3.33% | $6,730,000 | 1.54% | $437,952,000 |
| 2009 | $243,171,000 | 49.25% | $108,280,000 | 21.93% | $118,495,000 | 24.00% | $16,713,000 | 3.39% | $7,076,000 | 1.43% | $493,735,000 |
| 2010 | $245,330,000 | 50.73% | $111,317,000 | 23.02% | $101,640,000 | 21.02% | $17,990,000 | 3.72% | $7,322,000 | 1.51% | $483,599,000 |
| 2011 | $241,842,000 | 55.06% | $116,891,000 | 26.61% | $56,997,000 | 12.98% | $16,922,000 | 3.85% | $6,546,000 | 1.49% | $439,198,000 |
| 2012 | $252,901,000 | 57.97% | $122,975,000 | 28.19% | $37,649,000 | 8.63% | $15,283,000 | 3.50% | $7,459,000 | 1.71% | $436,267,000 |
| 2013 | $271,853,000 | 53.81% | $128,443,000 | 25.43% | $80,626,000 | 15.96% | $16,634,000 | 3.29% | $7,617,000 | 1.51% | $505,173,000 |
| Avg. | $161,305,286 | 53.53% | $76,747,286 | 25.61% | $49,202,571 | 15.55% | $10,983,095 | 3.62% | $4,908,190 | 1.69% | $303,146,429 |
Debt
The table below shows the amount of debt retired, issued, and outstanding in the district for each year.
| Debt | |||
|---|---|---|---|
| Fiscal Year |
Retired | Issued | Outstanding |
| Click [show] on the right to display the debt data for prior years. | |||
|---|---|---|---|
| 1993 | $4,670,000 | $30,000,000 | $66,580,000 |
| 1994 | $5,065,000 | $0 | $61,515,000 |
| 1995 | $7,930,000 | $73,000,000 | $126,585,000 |
| 1996 | $7,040,000 | $25,000,000 | $144,545,000 |
| 1997 | $8,045,000 | $0 | $136,500,000 |
| 1998 | $7,865,000 | $0 | $128,635,000 |
| 1999 | $47,530,000 | $69,000,000 | $150,105,000 |
| 2000 | $10,140,000 | $30,000,000 | $169,965,000 |
| 2001 | $27,185,000 | $17,015,000 | $159,795,000 |
| 2002 | $11,395,000 | $40,000,000 | $188,400,000 |
| 2003 | $36,065,000 | $119,971,000 | $273,398,000 |
| 2004 | $75,865,000 | $85,137,000 | $283,439,000 |
| 2005 | $18,242,000 | $36,424,000 | $301,621,000 |
| 2006 | $23,038,000 | $0 | $278,582,000 |
| 2007 | $55,461,000 | $111,822,000 | $334,944,000 |
| 2008 | $28,669,000 | $85,540,000 | $391,815,000 |
| 2009 | $31,382,000 | $69,730,000 | $430,164,000 |
| 2010 | $30,737,000 | $0 | $399,427,000 |
| 2011 | $33,709,000 | $0 | $366,291,000 |
| 2012 | $53,371,000 | $77,646,000 | $390,405,000 |
| 2013 | $68,894,000 | $73,970,000 | $396,563,000 |
| Avg. | $28,204,667 | $44,964,524 | $246,632,095 |
Contact information
![]()
Alpine School District
575 N. 100 E.
American Fork, UT 84003
Phone: (801) 610-8400
See also
| Utah | School Board Elections | News and Analysis |
|---|---|---|
 |
 | |
|
Alpine School District |
External links
References
- ↑ National Center for Education Statistics, "ELSI Table Generator," accessed June 17, 2014
- ↑ 2.0 2.1 2.2 United States Census Bureau, "Utah County, Utah," accessed May 14, 2014
- ↑ Utah County, "Election Results," accessed January 6, 2015
- ↑ Alpine School District, "ASD Welcomes New Superintendent," May 7, 2015
- ↑ Alpine School District, "School Board," accessed August 5, 2015
- ↑ United States Census Bureau, "Public School System Finances: Historical Data," accessed December 1, 2015
| |||||
State of Utah Salt Lake City (capital) | |
|---|---|
| Elections |
What's on my ballot? | Elections in 2025 | How to vote | How to run for office | Ballot measures |
| Government |
Who represents me? | U.S. President | U.S. Congress | Federal courts | State executives | State legislature | State and local courts | Counties | Cities | School districts | Public policy |
|
This school board-related article is a sprout; we plan on making it grow in the future. If you would like to help it grow, please consider donating to Ballotpedia. |