San Bernardino City Unified School District, California
| San Bernardino City Unified School District |
|---|
| San Bernardino, California |
| District details |
| Superintendent: Dale Marsden |
| # of school board members: 7 |
| Website: Link |
San Bernardino City Unified School District is a school district in California that serves the city of San Bernardino, California. The district was the 10th-largest school district in the state in the 2014-2015 school year and served 53,365 students.[1]
About the district
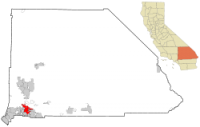
The San Bernardino City Unified School District is located in San Bernardino County in southeastern California. The county seat is San Bernardino. San Bernardino County was home to an estimated 2,140,096 residents in 2016, according to the United States Census Bureau.[2]
Demographics
San Bernardino County underperformed compared to California as a whole in terms of higher education achievement between 2011 and 2015. The United States Census Bureau found that 19 percent of county residents aged 25 years and older had attained a bachelor's degree, compared to 31.4 percent of state residents. The median household income for San Bernardino County was $53,433, compared to $61,818 for the entire state. The percentage of people in poverty in the county was 18.9 percent, while it was 15.3 percent statewide.[2]
| Racial Demographics, 2016[2] | |||
|---|---|---|---|
| Race | San Bernardino County (%) | California (%) | |
| White | 77.1 | 72.7 | |
| Black or African American | 9.5 | 6.5 | |
| American Indian and Alaska Native | 2.0 | 1.7 | |
| Asian | 7.4 | 14.8 | |
| Native Hawaiian or Other Pacific Islander | 0.5 | 0.5 | |
| Two or more races | 3.5 | 3.8 | |
| Hispanic or Latino | 52.8 | 38.9 | |
Note: Percentages for race and ethnicity may add up to more than 100 percent because respondents may report more than one race and the Hispanic/Latino ethnicity may be selected in conjunction with any race. Read more about race and ethnicity in the census here.
Superintendent
| |
This information is updated as we become aware of changes. Please contact us with any updates. |
Dale Marsden is the superintendent of the San Bernardino City Unified School District. Marsden was appointed superintendent in June 2012. Marsden's previous career experience includes working as the superintendent of the Victor Elementary School District and as a teacher and principal of Village Elementary School.[3]
School board elections
The San Bernardino City Board of Education is composed of seven members serving four-year terms.[4]
| San Bernardino City Unified Board of Education | ||
|---|---|---|
| Member | District | Term Ends |
| Gwen Dowdy-Rodgers | At-large | 2020 |
| Barbara Flores | At-large | 2022 |
| Mike Gallo | At-large | 2020 |
| Margaret Hill | At-large | 2020 |
| Abigail M. Medina | At-large | 2022 |
| Danny Tillman | At-large | 2022 |
| Scott Wyatt | At-large | 2020 |
| |
This officeholder information was last updated on February 12, 2020. Please contact us with any updates. | |
Election dates
The San Bernardino City Board of Education consists of seven members elected at large to four-year terms. Three or four seats are up for regular election on a staggered basis every other year. Board members used to be elected every November of odd-numbered years, but the board voted to switch to an even-year election schedule in December 2017. The first even-year election was held on November 3, 2020. Board members' terms were extended by one year to accommodate the change.[5][6]
A general election was scheduled for November 3, 2020.
Budget
From 1993 to 2013, the San Bernardino City Unified School District had an average of $455,415,429 in revenue and $451,822,143 in expenditures, according to the United States Census Bureau's survey of school system finances. The district had a yearly average of $97,878,571 in outstanding debt. The district retired $9,362,857 of its debt and issued $23,458,429 in new debt each year on average.[7]
Revenue
The table below separates the district's revenue into the three sources identified by the agency: local, state, and federal.
| Revenue by Source | |||||||||||
|---|---|---|---|---|---|---|---|---|---|---|---|
| Fiscal Year |
Local | State | Federal | Revenue Total | |||||||
| Total | % of Revenue | Total | % of Revenue | Total | % of Revenue | ||||||
| Click [show] on the right to display the revenue data for prior years. | |||||||||||
|---|---|---|---|---|---|---|---|---|---|---|---|
| 1993 | $32,753,000 | 15.20% | $165,243,000 | 76.67% | $17,515,000 | 8.13% | $215,511,000 | ||||
| 1994 | $37,922,000 | 16.66% | $168,344,000 | 73.95% | $21,392,000 | 9.40% | $227,658,000 | ||||
| 1995 | $45,078,000 | 19.94% | $158,219,000 | 70.00% | $22,724,000 | 10.05% | $226,021,000 | ||||
| 1996 | $45,593,000 | 18.78% | $171,629,000 | 70.70% | $25,540,000 | 10.52% | $242,762,000 | ||||
| 1997 | $42,140,000 | 14.79% | $218,738,000 | 76.75% | $24,138,000 | 8.47% | $285,016,000 | ||||
| 1998 | $41,172,000 | 14.33% | $216,334,000 | 75.30% | $29,798,000 | 10.37% | $287,304,000 | ||||
| 1999 | $41,853,000 | 12.89% | $251,369,000 | 77.45% | $31,353,000 | 9.66% | $324,575,000 | ||||
| 2000 | $50,586,000 | 14.44% | $262,641,000 | 74.98% | $37,062,000 | 10.58% | $350,289,000 | ||||
| 2001 | $53,524,000 | 13.38% | $306,325,000 | 76.56% | $40,277,000 | 10.07% | $400,126,000 | ||||
| 2002 | $79,856,000 | 17.28% | $330,664,000 | 71.56% | $51,535,000 | 11.15% | $462,055,000 | ||||
| 2003 | $53,509,000 | 10.86% | $382,791,000 | 77.67% | $56,564,000 | 11.48% | $492,864,000 | ||||
| 2004 | $58,964,000 | 11.96% | $365,216,000 | 74.08% | $68,822,000 | 13.96% | $493,002,000 | ||||
| 2005 | $55,578,000 | 10.74% | $387,178,000 | 74.80% | $74,836,000 | 14.46% | $517,592,000 | ||||
| 2006 | $49,739,000 | 9.03% | $416,054,000 | 75.52% | $85,134,000 | 15.45% | $550,927,000 | ||||
| 2007 | $65,459,000 | 10.57% | $475,527,000 | 76.77% | $78,412,000 | 12.66% | $619,398,000 | ||||
| 2008 | $66,781,000 | 8.37% | $657,628,000 | 82.43% | $73,382,000 | 9.20% | $797,791,000 | ||||
| 2009 | $66,596,000 | 10.28% | $478,476,000 | 73.89% | $102,481,000 | 15.83% | $647,553,000 | ||||
| 2010 | $52,160,000 | 8.03% | $496,658,000 | 76.48% | $100,616,000 | 15.49% | $649,434,000 |
| 2011 | $48,693,000 | 8.11% | $456,226,000 | 75.95% | $95,741,000 | 15.94% | $600,660,000 |
| 2012 | $51,485,000 | 8.38% | $461,395,000 | 75.05% | $101,866,000 | 16.57% | $614,746,000 |
| 2013 | $55,119,000 | 9.87% | $413,021,000 | 73.96% | $90,300,000 | 16.17% | $558,440,000 |
| Avg. | $52,121,905 | 12.57% | $344,746,476 | 75.26% | $58,547,048 | 12.17% | $455,415,429 |
Expenditures
The table below separates the district's expenditures into five categories identified by the agency:
- Instruction: operation expenditures, state payments on behalf of the district for instruction and benefits, and retirement system transfers
- Support Services: support services, food services, and retirement system transfers for support service staff
- Capital Spending: capital outlay expenditures (i.e., construction, land or facilities purchases, and equipment purchases)
- Debt & Gov. Payments: payments to state and local governments and interest on school system debt
- Other: all other non-K-12 programs, except food services
| Expenditures by Category | |||||||||||
|---|---|---|---|---|---|---|---|---|---|---|---|
| Fiscal Year |
Instruction | Support Services | Capital Spending | Debt & Gov. Payments | Other | Budget Total | |||||
| Total | % of Budget | Total | % of Budget | Total | % of Budget | Total | % of Budget | Total | % of Budget | ||
| Click [show] on the right to display the expenditure data for prior years. | |||||||||||
|---|---|---|---|---|---|---|---|---|---|---|---|
| 1993 | $116,225,000 | 56.13% | $76,159,000 | 36.78% | $10,448,000 | 5.05% | $0 | 0.00% | $4,223,000 | 2.04% | $207,055,000 |
| 1994 | $116,000,000 | 53.01% | $85,161,000 | 38.92% | $14,027,000 | 6.41% | $0 | 0.00% | $3,632,000 | 1.66% | $218,820,000 |
| 1995 | $117,989,000 | 50.46% | $88,601,000 | 37.89% | $20,252,000 | 8.66% | $151,000 | 0.06% | $6,819,000 | 2.92% | $233,812,000 |
| 1996 | $124,284,000 | 51.28% | $96,016,000 | 39.61% | $15,805,000 | 6.52% | $76,000 | 0.03% | $6,204,000 | 2.56% | $242,385,000 |
| 1997 | $137,999,000 | 50.59% | $102,050,000 | 37.41% | $27,653,000 | 10.14% | $867,000 | 0.32% | $4,215,000 | 1.55% | $272,784,000 |
| 1998 | $162,114,000 | 51.15% | $113,111,000 | 35.69% | $36,985,000 | 11.67% | $2,000 | 0.00% | $4,741,000 | 1.50% | $316,953,000 |
| 1999 | $162,092,000 | 48.04% | $121,761,000 | 36.09% | $47,438,000 | 14.06% | $1,383,000 | 0.41% | $4,705,000 | 1.39% | $337,379,000 |
| 2000 | $178,026,000 | 50.87% | $131,580,000 | 37.60% | $31,764,000 | 9.08% | $651,000 | 0.19% | $7,918,000 | 2.26% | $349,939,000 |
| 2001 | $201,263,000 | 50.10% | $147,297,000 | 36.67% | $41,665,000 | 10.37% | $1,562,000 | 0.39% | $9,905,000 | 2.47% | $401,692,000 |
| 2002 | $229,905,000 | 51.13% | $169,874,000 | 37.78% | $36,621,000 | 8.14% | $1,599,000 | 0.36% | $11,650,000 | 2.59% | $449,649,000 |
| 2003 | $233,651,000 | 53.30% | $173,946,000 | 39.68% | $17,284,000 | 3.94% | $1,686,000 | 0.38% | $11,766,000 | 2.68% | $438,333,000 |
| 2004 | $248,759,000 | 50.58% | $169,781,000 | 34.52% | $58,657,000 | 11.93% | $2,367,000 | 0.48% | $12,270,000 | 2.49% | $491,834,000 |
| 2005 | $266,164,000 | 50.39% | $188,778,000 | 35.74% | $56,806,000 | 10.76% | $2,631,000 | 0.50% | $13,790,000 | 2.61% | $528,169,000 |
| 2006 | $289,912,000 | 53.49% | $202,231,000 | 37.31% | $31,755,000 | 5.86% | $3,789,000 | 0.70% | $14,283,000 | 2.64% | $541,970,000 |
| 2007 | $295,805,000 | 47.47% | $211,763,000 | 33.98% | $92,985,000 | 14.92% | $5,845,000 | 0.94% | $16,798,000 | 2.70% | $623,196,000 |
| 2008 | $325,229,000 | 47.46% | $227,978,000 | 33.27% | $107,044,000 | 15.62% | $6,791,000 | 0.99% | $18,226,000 | 2.66% | $685,268,000 |
| 2009 | $309,407,000 | 45.57% | $232,403,000 | 34.23% | $111,614,000 | 16.44% | $6,809,000 | 1.00% | $18,733,000 | 2.76% | $678,966,000 |
| 2010 | $302,549,000 | 50.57% | $216,822,000 | 36.24% | $54,722,000 | 9.15% | $6,781,000 | 1.13% | $17,361,000 | 2.90% | $598,235,000 |
| 2011 | $289,297,000 | 47.70% | $216,761,000 | 35.74% | $77,762,000 | 12.82% | $6,951,000 | 1.15% | $15,682,000 | 2.59% | $606,453,000 |
| 2012 | $279,644,000 | 45.17% | $214,766,000 | 34.69% | $101,676,000 | 16.42% | $8,208,000 | 1.33% | $14,792,000 | 2.39% | $619,086,000 |
| 2013 | $274,992,000 | 42.55% | $217,122,000 | 33.60% | $130,235,000 | 20.15% | $9,040,000 | 1.40% | $14,898,000 | 2.31% | $646,287,000 |
| Avg. | $221,966,952 | 49.86% | $162,093,381 | 36.35% | $53,485,619 | 10.86% | $3,199,476 | 0.56% | $11,076,714 | 2.36% | $451,822,143 |
Debt
The table below shows the amount of debt retired, issued, and outstanding in the district for each year.
| Debt | |||
|---|---|---|---|
| Fiscal Year |
Retired | Issued | Outstanding |
| Click [show] on the right to display the debt data for prior years. | |||
|---|---|---|---|
| 1993 | $0 | $0 | $0 |
| 1994 | $0 | $0 | $0 |
| 1995 | $0 | $0 | $0 |
| 1996 | $0 | $0 | $0 |
| 1997 | $2,045,000 | $0 | $12,408,000 |
| 1998 | $0 | $0 | $0 |
| 1999 | $0 | $36,370,000 | $45,863,000 |
| 2000 | $37,507,000 | $0 | $8,356,000 |
| 2001 | $1,090,000 | $34,950,000 | $41,181,000 |
| 2002 | $660,000 | $27,870,000 | $68,391,000 |
| 2003 | $0 | $15,000,000 | $78,291,000 |
| 2004 | $30,998,000 | $0 | $108,454,000 |
| 2005 | $92,180,000 | $82,847,000 | $101,052,000 |
| 2006 | $3,965,000 | $68,824,000 | $161,946,000 |
| 2007 | $3,949,000 | $9,997,000 | $168,123,000 |
| 2008 | $4,205,000 | $0 | $165,394,000 |
| 2009 | $3,195,000 | $0 | $173,011,000 |
| 2010 | $3,716,000 | $0 | $170,580,000 |
| 2011 | $4,050,000 | $74,112,000 | $241,992,000 |
| 2012 | $4,345,000 | $0 | $184,722,000 |
| 2013 | $4,715,000 | $142,657,000 | $325,686,000 |
| Avg. | $9,362,857 | $23,458,429 | $97,878,571 |
Teacher salaries
San Bernardino City Unified School District employed 2,538 K-12 teachers during the 2011-12 school year. Teacher salaries are categorized based on higher education achievement, professional development and years of service. A teacher with a Bachelor's degree can earn higher salaries by pursuing graduate courses with raises at credit intervals. The salary schedule also accounts for graduate degrees by providing higher starting salaries and greater potential salaries. The following table details the salary schedule negotiated between the district and the San Bernardino Teachers Association for 2013 through 2014:[8]
| Salary structure | ||
|---|---|---|
| Degree level | Minimum salary daily rate ($) | Maximum salary daily rate($) |
| B.A. | 242.15 | 275.43 |
| B.A. + Credential | 253.25 | 341.96 |
| B.A. + 30 or M.A. | 253.25 | 397.42 |
| B.A. + 45 or M.A. + 15 | 264.34 | 452.88 |
| B.A. + 60 w/ M.A. or M.A. + 30 | 275.43 | 463.96 |
Schools in San Bernardino City Unified School District
Enrollment
The San Bernardino City Unified School District served 53,365 students in the 2014-2015 school year.[1]
District schools
San Bernardino City Unified School District operates 18 schools listed below in alphabetical order:[9]
| San Bernardino City Unified School District | ||
|---|---|---|
| Name | ||
| Alternative Learning Center | ||
| Anderson | ||
| Arrowhead Elementary | ||
| Arrowview Middle | ||
| Arroyo Valley High | ||
| ASA Charter | ||
| Barton Elementary | ||
| Belvedere Elementary | ||
| Bing Wong Elementary | ||
| Bradley Elmentary | ||
| Cajon High | ||
| Captain Leland Norton Elementary | ||
| Carden Virtual Academy | ||
| Carmack | ||
| Casa Ramona Academy for Technology, Community, and Education | ||
| Cesar E. Chavez Middle | ||
| Cole Elementary | ||
| Colonel Joseph C. Rodriguez PREP Academy | ||
| Crown Ridge Academy | ||
| Curtis Middle | ||
| Cypress Elementary | ||
| Davidson Elementary | ||
| Del Rosa Elementary | ||
| Del Vallejo Middle | ||
| E. Neal Roberts Elementary | ||
| Emmerton Elementary | ||
| Excel Prep Charter | ||
| Fairfax Elementary | ||
| Golden Valley Middle | ||
| Hardy Brown College Prep | ||
| Highland Pacific | ||
| Hillside Elementary | ||
| Howard Inghram Elementary | ||
| Juanita Blakely Jones Elementary | ||
| Kendall Elementary | ||
| Kimbark Elementary | ||
| Lankershim Elementary | ||
| Lincoln Elementary | ||
| Lydle Creek Elementary | ||
| Manuel A. Salinas Creative Arts Elementary | ||
| Marshall Elementary | ||
| Martin Luther King Jr. Middle | ||
| Middle College High | ||
| Monterey Elementary | ||
| Mt. Vernon Elementary | ||
| Muscoy Elementary | ||
| New Vision Middle | ||
| Newmark Elementary | ||
| North Park Elementary | ||
| North Verdemont Elementary | ||
| Oehl Elementary | ||
| Options for Youth-San Bernardino | ||
| Pacific High | ||
| Palm Avenue Elementary | ||
| Parkside Elementary | ||
| Provisional Accelerated Learning Academy | ||
| Public Safety Academy | ||
| Ramona-Alessandro Elementary | ||
| Richardson Prep High | ||
| Riley Elementary | ||
| Rio Vista Elementary | ||
| Roger Anton Elementary | ||
| Roosevelt Elementary | ||
| San Andreas Elementary | ||
| San Bernardino Elementary | ||
| San Gorgonio High | ||
| Serrano Middle | ||
| Shandin Hills Middle | ||
| Sierra High | ||
| SOAR Charter Academy | ||
| STAR at Anderson Community Day | ||
| Thompson Elementary | ||
| Urbita Elementary | ||
| Vermont Elementary | ||
| Warm Springs Elementary | ||
| Wilson Elementary | ||
| Yvonne Harmon | ||
Academic performance
California's Standardized Testing and Reporting (STAR) program, which includes the California Standards Tests (CST), the California Modified Assessment (CMA) and the California Alternate Performance Assessment (CAPA), measures the achievement of California content standards for grades 2-11. STAR results include English and mathematics in grades 2-11, science in grades 5 and 8-11 and history/social science in grades 8, 10 and 11. In high school, math and science tests reflect the course in which the student is enrolled. There are five STAR benchmarks to indicate a student's proficiency. "Proficient" or "Advanced" indicates that a student is meeting or exceeding state standards, which is the desired achievement goal for all students. The following table compares the percentage of district students who score at a "Proficient" or "Advanced" level with the statewide averages from the 2011-2012 school year.[10]
| STAR Performance Comparison | ||
|---|---|---|
| Subject | District average (%) | State average (%) |
| English Language Arts | 39 | 54 |
| Mathematics | 39 | 50 |
| Science | 44 | 57 |
| History/Social Science | 42 | 48 |
Issues
School shooting
A shooting at the district's North Park Elementary School on April 10, 2017, killed one student and one teacher and wounded a second student. The teacher's estranged husband fatally shot his wife in a special needs classroom before killing himself. The two children who were standing behind her were also shot, and one later died at a hospital from his injuries. Police said they did not believe the children had been targeted.[11]
Contact information
![]()
San Bernardino City Unified School District
777 North F Street
San Bernardino, CA 92410
Phone: (909) 381-1100
See also
| California | School Board Elections | News and Analysis |
|---|---|---|
 |
 | |
External links
Footnotes
- ↑ 1.0 1.1 U.S. Department of Education, National Center for Education Statistics, "Common Core of Data, file ccd_lea_052_1414_w_0216161a, 2014-2015," accessed November 16, 2016
- ↑ 2.0 2.1 2.2 United States Census Bureau, "QuickFacts: San Bernardino County, California; California," accessed August 4, 2017
- ↑ San Bernardino City Unified School District, "Meet Superintendent Dr. Dale Marsden," accessed January 17, 2014
- ↑ San Bernardino City Unified School District, "Board of Education," accessed January 7, 2014
- ↑ San Bernardino City School District, "Minutes of the Regular Meeting of the Board of Education December 5, 2017," accessed November 15, 2018
- ↑ San Bernardino City Unified School District, "Meet the Board," accessed August 10, 2015
- ↑ United States Census Bureau, "Public School System Finances: Historical Data," accessed December 1, 2015
- ↑ San Bernardino City Unified School District, "Agreement between San Bernardino City Unified School District and San Bernardino Teachers Association CTA/NEA," accessed January 17, 2014
- ↑ San Bernardino City Unified School District, "School Directory," accessed January 17, 2014
- ↑ Ed-Data, "Student Performance - 2012," accessed January 7, 2013
- ↑ CNN, "Student one of 3 dead in San Bernardino school shooting," April 11, 2017
| |||||
