Fact check: If unions go away does everybody’s pay go down?

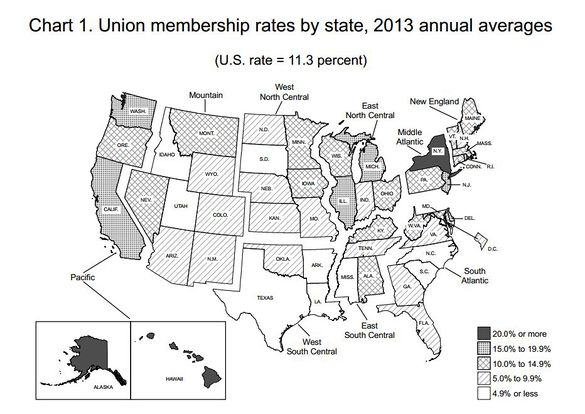
Source: Bureau of Labor Statistics – Union membership by state, 2013
August 4, 2016
By Paul Brennan
Tom Crofton is a Democratic candidate for the Assembly seat in southwestern Wisconsin’s 50th District who describes himself as “a blue collar guy who understands what a living wage is.”[1] Crofton, a former member of the Richland County Board of Supervisors, believes unions play an important role in creating “living wages.”
“Unions create a benchmark that other people come up close to,” Crofton told The Tomah Journal. “If the unions go away, everybody else’s pay goes down... it actually hurts the economy. It’s people buying things that makes our economy, so having a living wage is critical.”[2]
Is Crofton correct about the role unions play in setting wages? Does everybody else’s pay go down when unions “go away”?
Economists disagree about the impact unions have in setting wages for nonunion workers and the effect on overall wages that results from a decline in union membership.[3][4][5][6] However, it is possible to track the effect on per capita income (at the state level) during a period when union membership declines—and by that measure, Crofton’s claim that “everybody else’s pay goes down” is incorrect.
Ballotpedia examined personal per capita income in the 10 states that registered the biggest declines in the percentage of unionized workers over a 20-year period, and per capita income increased in all 10 states by a minimum of 28 percent and a maximum of 52.3 percent. Per capita income at the national level also increased during that period by 43.5 percent. In three of the 10 states we examined, the increase in per capita income was greater than the national average.
Union decline and per capita income in 10 states, 1993 to 2013
Union membership in the United States has been declining since it reached its peak in 1954, when 34.8 percent of American workers belonged to unions.[7] For the period from 1993 to 2013, the biggest declines in the percentage of union members in the workforce occurred in the following states: Indiana, Michigan, Ohio, Wisconsin, Minnesota, Pennsylvania, New Jersey, Hawaii, Utah, and Oregon.[8] Data on union membership is derived from the Current Population Survey (CPS), a joint project of the U.S. Census Bureau and the Bureau of Labor Statistics.[9] The CPS compiles statistics on the country’s workforce.
The Bureau of Economic Analysis (BEA) of the U.S. Commerce Department annually publishes state-level statistics on personal income, including personal per capita income.[10] Since Crofton claimed that everyone’s pay declines as unions “go away,” Ballotpedia examined personal per capita income, which the BEA defines as all income received by all persons in a state divided by the population of the state.[11]
The 20-year period was selected to prevent any one economic event, such as the 2008 financial crisis, from distorting long-term trends. Also, 2013 is the most recent year for which revised income data has been published. All dollar amounts have been adjusted for inflation to current 2016 dollars using the BLS Consumer Price Index Inflation Calculator.[12]
In 1993, personal per capita income at the national level was $31,598.[13] By 2013 it had risen to $45,352, an increase of 43.5 percent.[11] In all 10 states examined, per capita income also rose. Three of the states—Wisconsin, Minnesota, and Pennsylvania—saw larger increases in per capita income than the national average.
| Change in per capita income in the states with the largest decline in percentage of workers belonging to unions, 1993-2013 | ||||
|---|---|---|---|---|
| State | Percentage decline in union membership[8] | Per capita income in 1993*[13] | Per capita income in 2013*[11] | Percentage increase in per capita income |
| Indiana | 9.3 | $29,225 | $39,517 | 35.2 |
| Michigan | 8.3 | $31,156 | $39,928 | 28.0 |
| Ohio | 8.0 | $30,136 | $41,608 | 38.1 |
| Wisconsin | 7.1 | $29,911 | $43,933 | 46.9 |
| Minnesota | 7.0 | $31,987 | $48,726 | 52.3 |
| Pennsylvania | 6.3 | $32,261 | $46,761 | 44.9 |
| New Jersey | 6.2 | $40,929 | $57,011 | 39.3 |
| Hawaii | 6.0 | $35,257 | $46,482 | 31.8 |
| Utah | 6.0 | $24,290 | $36,933 | 52.1 |
| Oregon | 5.9 | $29,053 | $40,964 | 41.0 |
| *Adjusted for inflation to 2016 dollars using the Bureau of Labor Statistics Consumer Price Index Inflation Calculator | ||||
Conclusion
Wisconsin Assembly candidate Tom Crofton believes union wage rates affect how much everyone is paid, including nonunion members. “Unions create a benchmark that other people come up close to,” Crofton told a local newspaper. “If the unions go away, everybody else’s pay goes down.” There is no consensus among economists about the impact unions have on nonunion pay. However, Ballotpedia examined per capita income levels in the 10 states that had the biggest decline in the percentage of union members in the workforce over a 20 year period and found that per capita income rose in all 10 states. (Three of the states had larger increases than the national average.) While it is possible that the income gains would have been greater if union membership had stayed the same or increased, income did not fall when union membership declined, as Crofton claimed.
See also
- Wisconsin State Assembly elections, 2016
- Wisconsin Act 10, the "Scott Walker Budget Repair Bill" (2011)
- Right-to-work laws
Launched in October 2015 and active through October 2018, Fact Check by Ballotpedia examined claims made by elected officials, political appointees, and political candidates at the federal, state, and local levels. We evaluated claims made by politicians of all backgrounds and affiliations, subjecting them to the same objective and neutral examination process. As of 2025, Ballotpedia staff periodically review these articles to revaluate and reaffirm our conclusions. Please email us with questions, comments, or concerns about these articles. To learn more about fact-checking, click here.
Sources and Notes
- ↑ Tom Crofton—Progressive Democrat—50th Assembly District, “Biography,” accessed August 3, 2016
- ↑ The Tomah Journal, “Blue collar candidate makes second bid,” June 28, 2016
- ↑ Brigham Young University, “The Surprising Impacts of Unionization: Evidence from Matched Employer-Employee Data,” December 24, 2014
- ↑ Industrial and Labor Relations Review, “Union effects on nonunion wages: evidence from panel data on industries and cities,” October 1995
- ↑ Econometrica, “The Effect of Unions on the Structure of Wages: A Longitudinal Analysis,” July, 1996
- ↑ University of Notre Dame, “The Effects of ‘Right to Work’ Laws on Wages: Evidence from the Taft-Hartley Act of 1947,” September 2015
- ↑ Pew Research Center, "American unions membership declines as public support fluctuates," February 20 2014
- ↑ 8.0 8.1 UnionStats.com, "Union Membership, Coverage, Density, and Employment by State and Sector, 1983-2015," accessed August 2, 2016
- ↑ U.S. Census Bureau, “Current Population Survey,” accessed August 3, 2016
- ↑ Bureau of Economic Analysis, “Regional Economic Accounts,” accessed August 3, 2016
- ↑ 11.0 11.1 11.2 Bureau of Economic Analysis, "State personal income, 2013," March 25, 2014
- ↑ Bureau of Labor Statistics, “CPI Inflation Calculator,” accessed August 3, 2016
- ↑ 13.0 13.1 Bureau of Economic Analysis, "1997 State per capita personal income and state personal income," April 27, 1998
Contact
More from Fact Check by Ballotpedia
 July 29, 2016 |
 July 29, 2016 |
 July 27, 2016 |
Follow us on Facebook and Twitter

