Fact check: Is Oregon seriously underfunding education?

February 3, 2017
By Sara Reynolds
Oregon’s budget shortfall is projected to reach $1.7 billion over the next two years, but voters rejected a corporate tax increase estimated to raise $3 billion a year.[1] [2] Stressing the need for a legislative solution to the deficit, Oregon State Sen. Mark Hass, D-Beaverton, claimed: “We’re seriously underfunding education.”[3]
Is Hass correct? Is education underfunded in Oregon?
What constitutes sufficient funding is a matter of policy, not fact. Based on data from Oregon's 2017-2019 Budget, Oregon's Legislative Fiscal Office from fiscal year (FY) 2005 to FY 2015, and from the U.S. Census Bureau Public Education Finances publications, from FY 2005 to FY 2014, we found that:
- When adjusted for inflation, Oregon's total education expenditures have decreased by about $636 million between the FY 2005-2007 biennium and the projected 2017-2019 biennium.[1] [4]
- Per-pupil spending increased by $109 between FY 2005 and FY 2014.[5] [6]
- Education spending as a proportion of all state spending fell from 29.03 percent in the FY 2005-2007 biennium to 18.24 percent in the projected 2017-2019 biennium.[1] [4]
- Oregon's ranking among all states in per-pupil spending ranged between 26th and 32nd between FY 2005 and FY 2014.[5]
- The proportion of revenues from federal and local sources expended for education decreased, and the proportion of state funds increased, between FY 2005 and FY 2014.[5]
Background
Hass was elected to the state Senate in 2007 and serves on the Education Committee.[7]
Public school funding in Oregon largely shifted from local to state funding after the passage of Measure 5 in 1990. Measure 5 set property tax limits for local governments, shifting funding responsibility from the local to the state level.[8] As of December 2016, about 70 percent of public school funding comes from the state, mostly from the General Fund, which is primarily made up of personal and income tax revenues.[9]
Oregon's budget deficit is a result of healthcare and public pension costs as well as the use of taxes to generate revenue. Oregon does not have a general sales tax, and voters have repeatedly rejected sales taxes meant to ease financial difficulties. They also have a history of reducing property taxes, funds which would normally go towards education.[3] [10]
The Oregon Business Tax Increase Initiative, known as Measure 97, was expected to increase state revenue by $548 million during the first six months of 2017, and to add about $3 billion in each fiscal year beginning July 1, 2017.[2]
Total state education spending
Oregon’s Legislature passes a budget every two years, beginning July 1 and ending June 30 of each odd-numbered year.[1] Compared to the FY 2005-2007 biennium, education expenditures for projected 2017-2019 will have decreased by about $636 million, and education funding as a percent of total funds will have decreased from 29.03 percent to 18.24 percent.[6]
| State History of Education Expenditures | |||||
|---|---|---|---|---|---|
| Biennium Fiscal Years | Education Funds (Adjusted for Inflation) | Total Funds (Adjusted for Inflation) | Education Funding as a Percent of Total | Change in Education Funds from Previous Biennium | Percent Change in Education Funds from Previous Biennium |
| 2017-2019 [1] | $13.55 billion | $74.25 billion | 18.24% | $2.15 billion | 11.67 % |
| 2015-2017 | $11.39 billion | $67.33 billion | 16.92% | $337 million | 5.55% |
| 2013-2015 | $11.05 billion | $64.91 billion | 17.03% | $1.47 billion | 18.29% |
| 2011-2013 | $9.58 billion | $56.83 billion | 16.86% | ($5.85 billion) | (7.75%) |
| 2009-2011 | $15.43 billion | $64.59 billion | 23.89% | ($720 million) | 19.17% |
| 2007-2009 | $16.15 billion | $56.08 billion | 28.80% | $1.97 billion | 21.87% |
| 2005-2007 | $14.18 billion | $48.85 billion | 29.03% | $855 million | 5.95% |
| Source: Oregon Legislative Revenue Office, "2015 Oregon Public Finance: Basic Facts," February 1, 2015 (pg. B4) Numbers have been adjusted for inflation using the United States Bureau of Labor Statistics, "CPI Inflation Calculator," accessed January 19, 2017 | |||||
The 2017-2019 Governor's budget also allocated $2.85 billion for higher education, including the Higher Education Coordinating Commission (HECC), funding for public universities, community colleges, and other post-secondary education programs.[1]
Per-pupil funding
The U.S. Census Bureau publishes per-pupil K-12 education spending data for all states, including federal, state, and local expenditures combined.[11] Per-pupil spending in Oregon rose from $9,973 to $10,082 between FY 2005 and 2014, the latest year of data available.[12][6][11]
In FY 2014, New York spent the most per pupil ($20,895), and Utah spent the least ($6,590).[11] [6] Oregon ranked 30th among states and the District of Columbia in FY 2014, and its rank ranged from 26th and 32nd in per-pupil spending dating back to FY 2005.[5]
| Per-Pupil Public Elementary and Secondary School System Expenditures | |
|---|---|
| Fiscal Year | Expenditures (Adjusted for Inflation) |
| 2014 | $10,082 |
| 2013 | $9,832 |
| 2012 | $9,920 |
| 2011 | $10,331 |
| 2010 | $10,593 |
| 2009 | $10,969 |
| 2008 | $10,655 |
| 2007 | $10,418 |
| 2006 | $10,713 |
| 2005 | $9,973 |
| Source: United States Census Bureau, "Public Elementary–Secondary Education Finance Data," accessed December 28, 2016 Numbers have been adjusted for inflation using the United States Bureau of Labor Statistics, "CPI Inflation Calculator," accessed January 19, 2017 | |
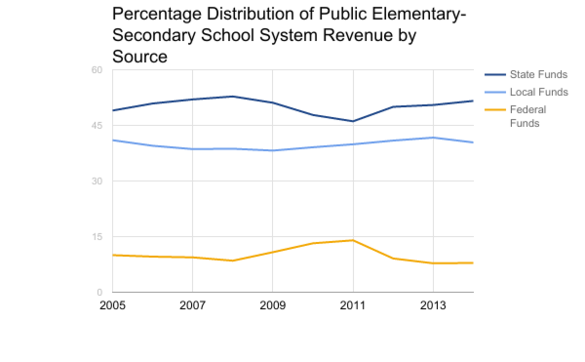
Public education revenue distribution by source
There are three sources of education funding in Oregon: local, state, and federal revenues. According to the U.S. Census Bureau, 51.6 percent of the funds for pre-kindergarten (pre-K) through 12th grade in FY 2014 came from state sources; 40.4 percent came from local sources; and 7.9 percent came from federal sources.[11] The FY 2014 distribution reflects:
- An overall decrease in federal funds between FY 2005 and FY 2014. During this period, federal funds changed the most, from a 14 percent high in FY 2011 to a 7.8 percent low in FY 2013. (The increase in federal funding between 2009 and 2011 represents supplemental funding from the federal government under the American Recovery and Reinvestment Act of 2009.[13])
- A slight decrease in local funds between FY 2005 and FY 2014, from 41 percent to 40.4 percent. Local funds were consistently below 40 percent between FY 2006 and FY 2011, but never went below 38.2 percent overall.
- An increase in state funds between FY 2005 and FY 2014, from 49 percent to 51.6 percent. State funds ranged from a high of 52.8 percent in 2008, to a low of 46.1 percent in FY 2011 (due to the recession).
Conclusion
Oregon faces a $1.7 billion budget shortfall over the next two years.[2] In response to the projected shortfall, Oregon State Senator Mark Hass, D-Beaverton, said: “We’re seriously underfunding education.”[3]
Ballotpedia reviewed data from Oregon's Legislative Fiscal Office and the U.S. Census Bureau Public Education Finances publications. We found that between fiscal year 2005 and the proposed budget for 2017-2019:
- Education expenditures decreased by $636 million between the FY 2005-2007 and FY 2017-2019 bienniums.[1] [4]
- There was an increase of $109 in annual per-pupil spending between FY 2005 and FY 2014.[5] [6]
- The percent of education spending as a total of all state spending fell from 29.03 percent in the FY 2005-2007 biennium to 18.24 percent in the projected 2017-2019 biennium.[1] [4]
- Between FY 2005 and FY 2014, Oregon ranked between 26th and 32nd for per-pupil spending, in comparison to other states.[5]
- The percent distribution of federal revenue sources decreased, from 10 percent in FY 2005, to 7.9 percent in FY 2014. The percent of local revenue sources also decreased, from 41 to 40.4 percent. The percent of state revenue sources increased, from 49 to 51.6 percent.
See also
Launched in October 2015 and active through October 2018, Fact Check by Ballotpedia examined claims made by elected officials, political appointees, and political candidates at the federal, state, and local levels. We evaluated claims made by politicians of all backgrounds and affiliations, subjecting them to the same objective and neutral examination process. As of 2026, Ballotpedia staff periodically review these articles to revaluate and reaffirm our conclusions. Please email us with questions, comments, or concerns about these articles. To learn more about fact-checking, click here.
Sources and Notes
- ↑ 1.0 1.1 1.2 1.3 1.4 1.5 1.6 1.7 Oregon.gov, "Governor's Budget," accessed December 12, 2016
- ↑ 2.0 2.1 2.2 Ballotpedia, "Oregon Business Tax Increase, Measure 97 (2016)," accessed December 11, 2016
- ↑ 3.0 3.1 3.2 The Oregonian, "After election, Oregon Legislature poised to focus on transportation and tax proposals in 2017," November 12, 2016
- ↑ 4.0 4.1 4.2 4.3 Oregon Legislative Revenue Office, "2015 Oregon Public Finance: Basic Facts," February 1, 2015 (pg. B4)
- ↑ 5.0 5.1 5.2 5.3 5.4 5.5 United States Census Bureau, "Public Elementary-Secondary Education Finance Data," accessed December 28, 2016
- ↑ 6.0 6.1 6.2 6.3 6.4 Numbers have been adjusted for inflation.
- ↑ Ballotpedia, "Mark Hass," accessed December 28, 2016
- ↑ State of Oregon Legislative Fiscal Office, "2015-2017 Legislative Adopted Budget Detailed Analysis," October 2015 (pg. 17)
- ↑ Oregon School Boards Association, "OSBA Revenue Reform Advisory Workgroup -- Final Report and Recommendations," December 16, 2016
- ↑ The Oregonian, "Oregon's history of rejecting tax reform and spending limits opened door for Measure 97," October 9, 2016
- ↑ 11.0 11.1 11.2 11.3 United States Census Bureau, "Public Education Finances: 2014," June 2016
- ↑ United States Census Bureau, "Public Education Finances: 2005," April 2007
- ↑ Ballotpedia, "American Recovery and Reinvestment Act," accessed January 25, 2017
Contact
More from Fact Check by Ballotpedia
 February 2, 2017 |
 January 31, 2017 |
Follow us on Facebook and Twitter


