School board election wrap-up: Did the Republican wave extend down the ballot?
2015 →
← 2013
|
Poll Opening and Closing Times |
November 7, 2014
By Daniel Anderson
In 23 states across America, voters cast ballots on November 4, 2014, to determine who would serve on their local school boards. Parents and residents in 452 of America's largest school districts voted on 2,736 candidates running for 1,532 seats. These new and returning board members will oversee school districts that educated a combined total of 11,397,068 K-12 students in the United States in the 2010-2011 school year.[1] Campaigns aren't over in Louisiana and Texas, where 10 districts and 20 seats are proceeding to December runoff elections.
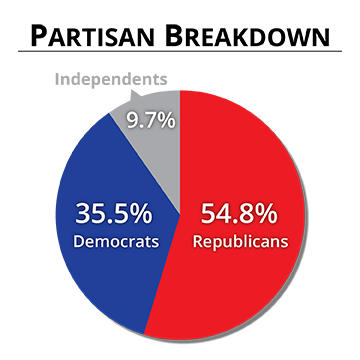
This year, incumbents achieved an 80.8 percent re-election rate and unopposed candidates won 34.1 percent of all seats by default. In the partisan races, Republicans won 54.8 percent of the seats up compared to the 35.5 percent won by Democrats and the 9.7 percent won by independents. Nevertheless, it is difficult to ascertain whether this is a reflection of the "Republican wave" effect elsewhere on the ballot.
The majority of school board elections are nonpartisan, which creates a small sample size for partisan analysis. Additionally, four of the six states that held partisan elections lean Republican: Alabama, Georgia, Louisiana and South Carolina. A fifth state, North Carolina, is typically a battleground. The only exception was Connecticut, which had just three of the 327 partisan seats up for election. Given the small sample size and the Republican lean of a majority of the states holding elections, Ballotpedia cannot state definitively whether or not this election constituted a Republican wave at the local level.
Immediately following the election, Ballotpedia published a detailed report on the top 25 school board races in the country. This report is intended to provide a more comprehensive "big picture" perspective on the results of the 2014 general election.
How many were unopposed?
A staggering 523 candidates ran unopposed and thereby captured 34.1 percent of all the seats up for election without a fight. Out of those unopposed candidates, there were 376 incumbents and 147 challengers. In terms of the partisan breakdown, 104 Republicans, 63 Democrats and 18 independents ran uncontested. On average, only 1.79 candidates filed to run for each school board seat up for election.
Which party triumphed?
In six states, 493 partisan candidates campaigned to win 327 seats on their school board in 56 school districts. Although every school board race in Alabama, Connecticut and Louisiana was partisan, there were some nonpartisan races in Georgia, North Carolina and South Carolina.
The election featured 226 Republican candidates, 208 Democratic candidates, 57 independent candidates and two Libertarian candidates. Republicans won 54.8 percent of the seats, Democrats won 35.5 percent of the seats, independents won 9.7 percent of the seats and Libertarians won zero seats. Democrats experienced their most success in Connecticut and Louisiana, while Republicans dominated elsewhere. Louisiana was the only state with independent winners.
In Louisiana, 17 of the elections resulted in a runoff scheduled for December 6, 2014. Neither those 17 seats nor the 34 general election winners proceeding to the runoff are represented in the table below or the party victory percentages in the previous paragraph.
| Partisan results by state | |||||
|---|---|---|---|---|---|
| State | Total seats up for election (partisan districts only) |
Democratic winners |
Republican winners |
Independent winners |
Libertarian winners |
| Alabama | 22 | 4 | 18 | 0 | 0 |
| Connecticut | 3 | 3 | 0 | 0 | 0 |
| Georgia | 51 | 13 | 38 | 0 | 0 |
| Louisiana | 207 | 83 | 94 | 30 | 0 |
| North Carolina | 21 | 6 | 15 | 0 | 0 |
| South Carolina | 6 | 1 | 5 | 0 | 0 |
| Total: | 310 | 110 | 170 | 30 | 0 |
How did the incumbents fare?
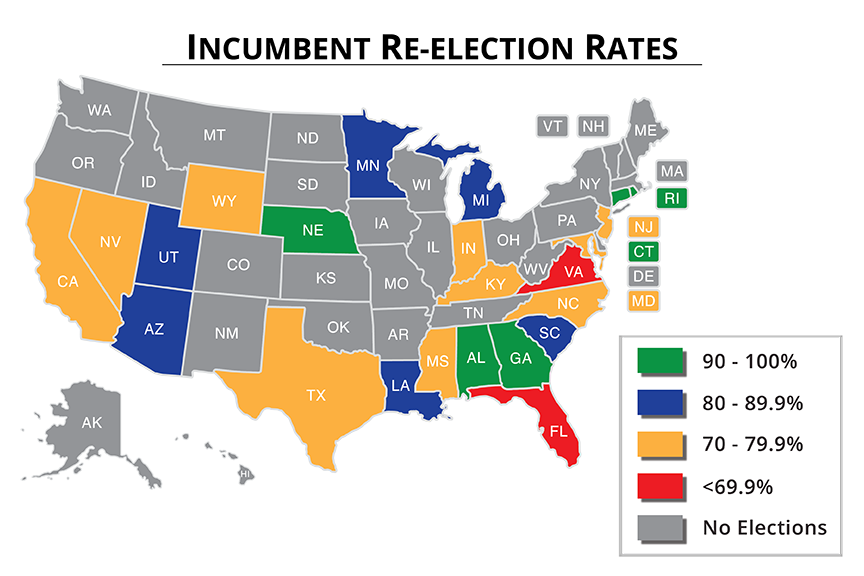
Out of all 2,736 candidates for school board, 1,139 were incumbents campaigning for re-election. A total of 920 incumbents won re-election, which resulted in an 80.8 percent re-election rate. This was almost exactly the same rate as the 80.5 percent in November 2013's school board elections, when 331 of 411 incumbents were re-elected. Incumbents swept their races in Connecticut, Nebraska and Rhode Island. Conversely, they achieved just a 60.0 percent re-election rate in Virginia, a 62.5 percent rate in Florida and a 70.0 percent rate in North Carolina.
An additional nine incumbents in Louisiana are proceeding to a runoff election on December 6, 2014. Those incumbents are not represented in the re-election rates stated above or in the table below.
| Incumbent results by state | ||||
|---|---|---|---|---|
| State | Total seats up for election | Incumbents seeking re-election | Incumbents re-elected | Re-election rate |
| Alabama | 22 | 16 | 15 | 93.8% |
| Arizona | 70 | 39 | 35 | 89.7% |
| California | 399 | 314 | 248 | 79.8% |
| Connecticut | 3 | 2 | 2 | 100.0% |
| Florida | 33 | 16 | 10 | 62.5% |
| Georgia | 56 | 40 | 38 | 95.0% |
| Indiana | 83 | 70 | 55 | 78.6% |
| Kentucky | 28 | 23 | 18 | 78.3% |
| Louisiana | 224 | 180 | 153 | 85.0% |
| Maryland | 42 | 27 | 19 | 70.4% |
| Michigan | 77 | 56 | 50 | 89.3% |
| Minnesota | 33 | 23 | 20 | 87.0% |
| Mississippi | 5 | 4 | 3 | 75.0% |
| Nebraska | 13 | 12 | 12 | 100.0% |
| Nevada | 9 | 7 | 5 | 71.4% |
| New Jersey | 50 | 36 | 28 | 77.8% |
| North Carolina | 112 | 70 | 49 | 70.0% |
| Rhode Island | 10 | 8 | 8 | 100.0% |
| South Carolina | 91 | 68 | 57 | 83.8% |
| Texas | 95 | 72 | 53 | 73.6% |
| Utah | 50 | 37 | 30 | 81.1% |
| Virginia | 19 | 15 | 9 | 60.0% |
| Wyoming | 8 | 4 | 3 | 75.0% |
| Total: | 1,532 | 1,139 | 920 | 80.8% |
See also
- School board elections, 2014
- Election results, 2014
- Links to all election results, 2014
- Voter backlash down the ballot: Incumbency advantage drops in November's hottest school board races
Footnotes
| |||||


