Scott Rasmussen's Number of the Day for September 22, 2017
The Number of the Day columns published on Ballotpedia reflect the views of the author.
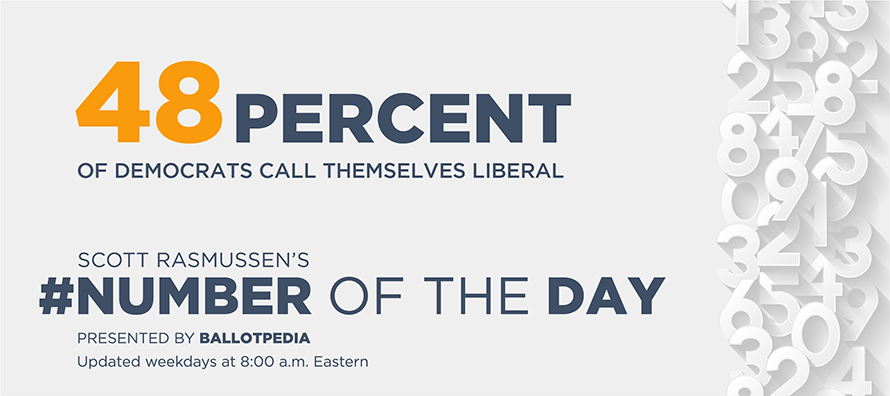
September 22, 2017: Forty-eight percent (48%) of Democrats now call themselves liberal, a 20-point increase from the beginning of the century when that figure was 28%.[1]
At the same time, the number of self-described conservatives in the Democratic Party has fallen from 23% in 2000 to 13% today. This data was provided by the Pew Research Center and is based on registered voters who are Democrats or independents who lean Democratic.
Putting the numbers in context highlights a significant change in the party over the past 17 years. When the 21st century began, there were nearly as many conservatives (23%) as liberals (28%) in the Democratic Party. Now, however, liberals outnumber conservative in the party by a three-to-one margin (48% to 15%).
The number of Democrats considering themselves liberal jumped following the Republican midterm victories in 2010 and 2014. It jumped again following the 2016 presidential election.
While there was also a shift in the Republican Party, it is not nearly as dramatic. In 2000, 57% of Republicans considered themselves conservative. That number first edged over 60% following the election of Barack Obama and is at 65% today.[2]
These numbers suggest that the growing gap between the parties results more from the Democrats moving left than from the Republicans moving right.
| Among Democrats and Democratic-leaning independents | |||||
|---|---|---|---|---|---|
| Year | Conservative | Moderate | Liberal | Don't know | Net[3] |
| 2000 | 23% | 44% | 28% | 6% | 5% |
| 2001 | 23% | 43% | 29% | 4% | 5% |
| 2002 | 25% | 44% | 27% | 4% | 3% |
| 2003 | 23% | 45% | 29% | 3% | 6% |
| 2004 | 22% | 45% | 30% | 4% | 8% |
| 2005 | 20% | 45% | 32% | 4% | 12% |
| 2006 | 21% | 44% | 31% | 4% | 10% |
| 2007 | 21% | 43% | 31% | 4% | 10% |
| 2008 | 23% | 41% | 33% | 4% | 10% |
| 2009 | 22% | 42% | 32% | 4% | 10% |
| 2010 | 21% | 41% | 34% | 4% | 13% |
| 2011 | 20% | 43% | 34% | 3% | 13% |
| 2012 | 19% | 41% | 36% | 4% | 17% |
| 2013 | 21% | 41% | 35% | 2% | 14% |
| 2014 | 18% | 40% | 39% | 3% | 21% |
| 2015 | 17% | 38% | 42% | 2% | 25% |
| 2016 | 16% | 38% | 44% | 2% | 29% |
| 2017 | 15% | 36% | 48% | 2% | 33% |
| Among Republicans and Republican-leaning independents | |||||
|---|---|---|---|---|---|
| Year | Conservative | Moderate | Liberal | Don't know | Net[3] |
| 2000 | 58% | 32% | 6% | 4% | 52% |
| 2001 | 58% | 34% | 6% | 3% | 52% |
| 2002 | 58% | 34% | 5% | 2% | 53% |
| 2003 | 59% | 34% | 5% | 2% | 54% |
| 2004 | 60% | 32% | 5% | 2% | 55% |
| 2005 | 60% | 33% | 5% | 2% | 55% |
| 2006 | 61% | 32% | 5% | 2% | 56% |
| 2007 | 63% | 31% | 4% | 2% | 59% |
| 2008 | 65% | 29% | 5% | 2% | 60% |
| 2009 | 65% | 29% | 5% | 2% | 60% |
| 2010 | 66% | 28% | 5% | 2% | 60% |
| 2011 | 64% | 30% | 5% | 1% | 59% |
| 2012 | 65% | 29% | 4% | 2% | 61% |
| 2013 | 66% | 28% | 5% | 2% | 60% |
| 2014 | 66% | 28% | 5% | 1% | 60% |
| 2015 | 65% | 28% | 5% | 2% | 61% |
| 2016 | 66% | 28% | 5% | 2% | 61% |
| 2017 | 68% | 27% | 4% | 1% | 64% |
Each weekday, Scott Rasmussen’s Number of the Day explores interesting and newsworthy topics at the intersection of culture, politics, and technology.
- September 21, 2017 – 50% of millennials would give up voting to have student loans forgiven
- September 20, 2017 – 1,597 bank branches closed by Bank of America since 2009
- September 19, 2017 – 60 percent of second-generation Mexican immigrants describe themselves as typical Americans
- September 18, 2017 – 64 percent of Americans have positive view of police
- September 15, 2017 – 37 percent of Americans can’t name First Amendment rights
- To see other recent numbers, check out the archive.
Scott Rasmussen’s Number of the Day is published by Ballotpedia weekdays at 8:00 a.m. Eastern. Click here to check out the latest update.
The Number of the Day is broadcast on local stations across the country. An archive of these broadcasts can be found here.
Columns published on Ballotpedia reflect the views of the author.
Ballotpedia is the nonprofit, nonpartisan Encyclopedia of American Politics.
See also
Footnotes
- ↑ Pew Research Center, "Democratic voters are increasingly likely to call their views liberal," September 7, 2017
- ↑ Pew Research Center data provided by email to Scott Rasmussen on September 20, 2017
- ↑ 3.0 3.1 This column gives the net percentage-point difference between those self-identifying as conservative and those self-identifying as liberal. Some numbers may appear off by one due to rounding.
| |||||||||||||||||||||||


