Your feedback ensures we stay focused on the facts that matter to you most—take our survey
Paramount Unified School District, California
Ballotpedia provides comprehensive election coverage of the 100 largest cities in America by population as well as mayoral, city council, and district attorney election coverage in state capitals outside of the 100 largest cities. This school district is outside of that coverage scope and does not receive scheduled updates.
| Paramount Unified School District |
|---|
| Paramount, California |
| District details |
| Superintendent: Ruth Pérez |
| # of school board members: 5 |
| Website: Link |
Paramount Unified School District is a school district in California that serves the city of Paramount, California. It was the 100th largest school district in California, serving 15,929 students in 18 schools with an operating budget of $257.0 million.[1][2]
About the district
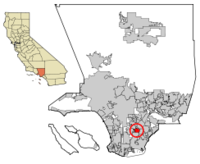
Paramount Unified School District is located in southern Los Angeles County, California in Paramount, California. It is located in the largest county in California. According to the 2010 Census, it was home to 54,098 residents.[3]
Demographics
Paramount underperform the rest of California when measured on the basis of median household income, percentage of residents living below the poverty level, percentage of residents over the age of 25 with a Bachelor's degree and percentage of residents over the age of 25 with a high school diploma. The median household income in Paramount was $42,831 compared to $61,632 for the state of California. 8.2% of Paramount residents aged 25 years and older attained a Bachelor's degree compared to a 30.2 in California. The United States Census also showed the poverty rate in Paramount was 21.2% compared to 14.4% for the entire state. The United States Census also found that 56.3% of Paramount residents aged 25 years and older attained a high school degree compared to a 80.8% in California.[4]
|
| |||||||||||||||||||||||||||||||||||||||||||||||||||||||||
Note: Percentages for race and ethnicity may add up to more than 100 percent because respondents may report more than one race and the Hispanic/Latino ethnicity may be selected in conjunction with any race. Read more about race and ethnicity in the census here.
Superintendent
| |
This information is updated as we become aware of changes. Please contact us with any updates. |
Ruth Pérez (January 2016 - Present)
Ruth Pérez is the superintendent of the Paramount Unified School District. She has served in this role since January 4, 2016. Prior to taking on the role, she served as deputy superintendent of instruction for the Los Angeles Unified School District. Pérez also previously served as the superintendent of the Norwalk-La Mirada Unified School District, as the chief academic officer for the Charlotte-Mecklenburg School District in North Carolina, and as the area superintendent for the Orange County Public School District in Florida. She earned a bachelor's degree from Queen’s University and a master's degree and a doctoral degree from Nova Southeastern University.[7][8]
David Verdugo and Dee Stephens (January 2015 - January 2016)
David Verdugo and Dee Stephens served as interim superintendents of the district from January 2015 to January 2016.[8]
Herman M. Mendez (July 2013 - January 2014)
Herman M. Mendez served as superintendent of the district from July 2013 to January 2014. Prior to serving in this role Mendez served as the assistant superintendent of elementary education with the Santa Ana Unified School District. Mendez earned a bachelor's degree and a master's degree from the California State University system. In 2011, he was recognized by the Orange County Music and Arts Administrators as the Outstanding Arts Education Administrator.[8][9]
School board elections
The Paramount Unified Board of Education is composed of five members serving four-year terms.[10]
| |
This officeholder information was last updated on January 31, 2020. Please contact us with any updates. | |
Election dates
The Paramount Unified Board of Education consists of five members elected at large to four-year terms. Members were previously elected on a staggered basis every November of odd-numbered years, but the district switched to hold elections in even-numbered years. Board members' terms were extended by one year in order to accommodate the change. The first even-year election was held on November 6, 2018.[11][12]
Budget
From 1993 to 2013, the Paramount Unified School District had an average of $128,735,095 in revenue and $131,187,476 in expenditures, according to the United States Census Bureau's survey of school system finances. The district had a yearly average of $56,523,857 in outstanding debt. The district retired $3,191,190 of its debt and issued $3,644,714 in new debt each year on average.[13]
Revenue
The table below separates the district's revenue into the three sources identified by the agency: local, state, and federal.
| Revenue by Source | |||||||||||
|---|---|---|---|---|---|---|---|---|---|---|---|
| Fiscal Year |
Local | State | Federal | Revenue Total | |||||||
| Total | % of Revenue | Total | % of Revenue | Total | % of Revenue | ||||||
| Click [show] on the right to display the revenue data for prior years. | |||||||||||
|---|---|---|---|---|---|---|---|---|---|---|---|
| 1993 | $8,811,000 | 14.34% | $46,900,000 | 76.31% | $5,750,000 | 9.36% | $61,461,000 | ||||
| 1994 | $14,964,000 | 23.78% | $42,048,000 | 66.83% | $5,910,000 | 9.39% | $62,922,000 | ||||
| 1995 | $17,482,000 | 26.41% | $42,177,000 | 63.72% | $6,531,000 | 9.87% | $66,190,000 | ||||
| 1996 | $19,174,000 | 25.37% | $48,950,000 | 64.77% | $7,450,000 | 9.86% | $75,574,000 | ||||
| 1997 | $29,746,000 | 30.46% | $59,810,000 | 61.24% | $8,103,000 | 8.30% | $97,659,000 | ||||
| 1998 | $19,672,000 | 20.69% | $66,350,000 | 69.79% | $9,045,000 | 9.51% | $95,067,000 | ||||
| 1999 | $22,762,000 | 20.88% | $76,276,000 | 69.97% | $9,968,000 | 9.14% | $109,006,000 | ||||
| 2000 | $22,703,000 | 19.82% | $79,909,000 | 69.76% | $11,936,000 | 10.42% | $114,548,000 | ||||
| 2001 | $24,120,000 | 17.18% | $104,146,000 | 74.19% | $12,106,000 | 8.62% | $140,372,000 | ||||
| 2002 | $24,675,000 | 19.21% | $91,344,000 | 71.10% | $12,451,000 | 9.69% | $128,470,000 | ||||
| 2003 | $38,105,000 | 26.00% | $93,752,000 | 63.96% | $14,717,000 | 10.04% | $146,574,000 | ||||
| 2004 | $29,177,000 | 15.33% | $143,759,000 | 75.54% | $17,379,000 | 9.13% | $190,315,000 | ||||
| 2005 | $25,652,000 | 15.08% | $123,983,000 | 72.90% | $20,443,000 | 12.02% | $170,078,000 | ||||
| 2006 | $22,173,000 | 14.55% | $110,078,000 | 72.21% | $20,183,000 | 13.24% | $152,434,000 | ||||
| 2007 | $25,802,000 | 16.03% | $115,007,000 | 71.45% | $20,152,000 | 12.52% | $160,961,000 | ||||
| 2008 | $26,946,000 | 16.16% | $121,427,000 | 72.82% | $18,367,000 | 11.02% | $166,740,000 | ||||
| 2009 | $26,802,000 | 17.17% | $110,653,000 | 70.91% | $18,600,000 | 11.92% | $156,055,000 | ||||
| 2010 | $23,238,000 | 15.52% | $101,262,000 | 67.62% | $25,261,000 | 16.87% | $149,761,000 |
| 2011 | $31,240,000 | 18.24% | $114,880,000 | 67.06% | $25,185,000 | 14.70% | $171,305,000 |
| 2012 | $21,815,000 | 15.19% | $99,621,000 | 69.34% | $22,224,000 | 15.47% | $143,660,000 |
| 2013 | $30,483,000 | 21.13% | $94,754,000 | 65.67% | $19,048,000 | 13.20% | $144,285,000 |
| Avg. | $24,073,429 | 19.45% | $89,861,238 | 69.39% | $14,800,429 | 11.16% | $128,735,095 |
Expenditures
The table below separates the district's expenditures into five categories identified by the agency:
- Instruction: operation expenditures, state payments on behalf of the district for instruction and benefits, and retirement system transfers
- Support Services: support services, food services, and retirement system transfers for support service staff
- Capital Spending: capital outlay expenditures (i.e., construction, land or facilities purchases, and equipment purchases)
- Debt & Gov. Payments: payments to state and local governments and interest on school system debt
- Other: all other non-K-12 programs, except food services
| Expenditures by Category | |||||||||||
|---|---|---|---|---|---|---|---|---|---|---|---|
| Fiscal Year |
Instruction | Support Services | Capital Spending | Debt & Gov. Payments | Other | Budget Total | |||||
| Total | % of Budget | Total | % of Budget | Total | % of Budget | Total | % of Budget | Total | % of Budget | ||
| Click [show] on the right to display the expenditure data for prior years. | |||||||||||
|---|---|---|---|---|---|---|---|---|---|---|---|
| 1993 | $34,292,000 | 53.86% | $25,244,000 | 39.65% | $1,883,000 | 2.96% | $392,000 | 0.62% | $1,860,000 | 2.92% | $63,671,000 |
| 1994 | $35,427,000 | 57.63% | $22,479,000 | 36.56% | $1,443,000 | 2.35% | $277,000 | 0.45% | $1,851,000 | 3.01% | $61,477,000 |
| 1995 | $37,189,000 | 56.27% | $23,842,000 | 36.07% | $3,125,000 | 4.73% | $313,000 | 0.47% | $1,623,000 | 2.46% | $66,092,000 |
| 1996 | $39,782,000 | 51.23% | $27,310,000 | 35.17% | $7,380,000 | 9.50% | $571,000 | 0.74% | $2,606,000 | 3.36% | $77,649,000 |
| 1997 | $46,743,000 | 50.19% | $31,310,000 | 33.62% | $10,892,000 | 11.69% | $1,912,000 | 2.05% | $2,283,000 | 2.45% | $93,140,000 |
| 1998 | $49,777,000 | 48.02% | $33,356,000 | 32.18% | $17,202,000 | 16.60% | $1,186,000 | 1.14% | $2,131,000 | 2.06% | $103,652,000 |
| 1999 | $50,874,000 | 46.27% | $35,831,000 | 32.59% | $18,969,000 | 17.25% | $2,201,000 | 2.00% | $2,069,000 | 1.88% | $109,944,000 |
| 2000 | $60,764,000 | 51.57% | $36,449,000 | 30.94% | $17,006,000 | 14.43% | $1,314,000 | 1.12% | $2,285,000 | 1.94% | $117,818,000 |
| 2001 | $66,561,000 | 54.12% | $39,083,000 | 31.78% | $13,126,000 | 10.67% | $1,308,000 | 1.06% | $2,915,000 | 2.37% | $122,993,000 |
| 2002 | $73,571,000 | 52.67% | $42,454,000 | 30.39% | $18,566,000 | 13.29% | $1,302,000 | 0.93% | $3,787,000 | 2.71% | $139,680,000 |
| 2003 | $71,890,000 | 52.44% | $47,352,000 | 34.54% | $9,941,000 | 7.25% | $1,973,000 | 1.44% | $5,944,000 | 4.34% | $137,100,000 |
| 2004 | $70,891,000 | 46.21% | $47,442,000 | 30.93% | $27,654,000 | 18.03% | $1,901,000 | 1.24% | $5,507,000 | 3.59% | $153,395,000 |
| 2005 | $75,300,000 | 42.16% | $53,050,000 | 29.70% | $41,907,000 | 23.46% | $2,017,000 | 1.13% | $6,323,000 | 3.54% | $178,597,000 |
| 2006 | $86,803,000 | 52.38% | $53,138,000 | 32.07% | $16,178,000 | 9.76% | $2,064,000 | 1.25% | $7,522,000 | 4.54% | $165,705,000 |
| 2007 | $87,313,000 | 54.76% | $57,100,000 | 35.81% | $5,377,000 | 3.37% | $2,106,000 | 1.32% | $7,562,000 | 4.74% | $159,458,000 |
| 2008 | $87,777,000 | 53.65% | $58,071,000 | 35.49% | $6,830,000 | 4.17% | $2,593,000 | 1.58% | $8,346,000 | 5.10% | $163,617,000 |
| 2009 | $82,847,000 | 48.54% | $57,768,000 | 33.85% | $19,053,000 | 11.16% | $3,433,000 | 2.01% | $7,566,000 | 4.43% | $170,667,000 |
| 2010 | $82,458,000 | 50.65% | $54,547,000 | 33.50% | $17,559,000 | 10.79% | $2,630,000 | 1.62% | $5,609,000 | 3.45% | $162,803,000 |
| 2011 | $81,855,000 | 45.86% | $54,321,000 | 30.43% | $34,784,000 | 19.49% | $2,788,000 | 1.56% | $4,738,000 | 2.65% | $178,486,000 |
| 2012 | $80,585,000 | 46.15% | $54,871,000 | 31.42% | $31,146,000 | 17.84% | $3,448,000 | 1.97% | $4,571,000 | 2.62% | $174,621,000 |
| 2013 | $80,683,000 | 52.27% | $55,248,000 | 35.79% | $10,460,000 | 6.78% | $3,534,000 | 2.29% | $4,447,000 | 2.88% | $154,372,000 |
| Avg. | $65,875,333 | 50.80% | $43,346,000 | 33.45% | $15,737,190 | 11.22% | $1,869,667 | 1.33% | $4,359,286 | 3.19% | $131,187,476 |
Debt
The table below shows the amount of debt retired, issued, and outstanding in the district for each year.
| Debt | |||
|---|---|---|---|
| Fiscal Year |
Retired | Issued | Outstanding |
| Click [show] on the right to display the debt data for prior years. | |||
|---|---|---|---|
| 1993 | $0 | $0 | $0 |
| 1994 | $0 | $0 | $0 |
| 1995 | $0 | $0 | $0 |
| 1996 | $0 | $0 | $0 |
| 1997 | $4,516,000 | $0 | $27,251,000 |
| 1998 | $1,570,000 | $4,000,000 | $26,025,000 |
| 1999 | $8,455,000 | $30,658,000 | $55,355,000 |
| 2000 | $460,000 | $789,000 | $55,684,000 |
| 2001 | $635,000 | $844,000 | $55,893,000 |
| 2002 | $21,172,000 | $31,260,000 | $65,981,000 |
| 2003 | $620,000 | $504,000 | $65,865,000 |
| 2004 | $5,675,000 | $0 | $60,190,000 |
| 2005 | $2,960,000 | $0 | $65,700,000 |
| 2006 | $2,501,000 | $0 | $60,239,000 |
| 2007 | $3,174,000 | $0 | $57,064,000 |
| 2008 | $3,276,000 | $8,484,000 | $62,272,000 |
| 2009 | $2,790,000 | $0 | $93,904,000 |
| 2010 | $1,146,000 | $0 | $94,667,000 |
| 2011 | $3,530,000 | $0 | $89,935,000 |
| 2012 | $2,855,000 | $0 | $125,243,000 |
| 2013 | $1,680,000 | $0 | $125,733,000 |
| Avg. | $3,191,190 | $3,644,714 | $56,523,857 |
Teacher salaries
Paramount Unified School District employed 595 K-12 teachers during the 2011-12 school year. Teacher salaries are categorized based on higher education achievement, professional development and years of service. A teacher with a Bachelor's degree can earn higher salaries by pursuing graduate courses with raises at credit intervals. The salary schedule also accounts for graduate degrees by providing higher starting salaries and greater potential salaries. The following table details the salary schedule negotiated between the district and the Paramoiunt Teachers Association for 2011 through 2014:[14]
| Salary structure | ||
|---|---|---|
| Degree level | Minimum salary ($) | Maximum salary ($) |
| B.A. | 44,636 | 73,049 |
| B.A. + 30 | 46,868 | 76,327 |
| B.A. + 45 or M.A. | 49,211 | 79,768 |
| B.A. + 60 w/ M.A. | 51,672 | 83,384 |
| B.A. + 75 w/ M.A. | 54,256 | 87,179 |
Schools in Paramount Unified School District
Enrollment
Paramount Unified School District serves 15,929 students in 18 schools.[1]
District schools
Paramount Unified School District operates 18 schools listed below in alphabetical order:[15]
| Paramount Unified School District | ||
|---|---|---|
| Name | ||
| Abraham Lincoln | ||
| Alondra Middle | ||
| Buena Vista High | ||
| Captain Raymond Collins | ||
| Frank J. Zamboni | ||
| Harry Wirtz Elementary | ||
| Hollydale | ||
| Howard Tanner | ||
| Jefferson Elementary | ||
| Leona Jackson | ||
| Los Cerritos | ||
| Major Lynn Mokler | ||
| Mark Keppel | ||
| Paramount High | ||
| Paramount Park Middle | ||
| Paramount Unified Community Day | ||
| Theodore Roosevelt | ||
| Wesley Gaines | ||
Academic performance
California's Standardized Testing and Reporting (STAR) program, which includes the California Standards Tests (CST), the California Modified Assessment (CMA) and the California Alternate Performance Assessment (CAPA), measures the achievement of California content standards for grades 2-11. STAR results include English and mathematics in grades 2-11, science in grades 5 and 8-11 and history/social science in grades 8, 10 and 11. In high school, math and science tests reflect the course in which the student is enrolled. There are five STAR benchmarks to indicate a student's proficiency. "Proficient" or "Advanced" indicates that a student is meeting or exceeding state standards, which is the desired achievement goal for all students. The following table compares the percentage of district students who score at a "Proficient" or "Advanced" level with the statewide averages from the 2011-2012 school year.[16]
| STAR Performance Comparison | ||
|---|---|---|
| Subject | District average (%) | State average (%) |
| English Language Arts | 46 | 54 |
| Mathematics | 52 | 50 |
| Science | 48 | 57 |
| History/Social Science | 42 | 48 |
Contact information

Paramount Unified School District
15110 California Ave.
Paramount, CA 90723
Phone:562-602-6000
See also
| California | School Board Elections | News and Analysis |
|---|---|---|
 |
 | |
External links
Footnotes
- ↑ 1.0 1.1 Ed-Data, "District Profile - Fiscal Year: 2011-12," accessed January 7, 2014
- ↑ Cite error: Invalid
<ref>tag; no text was provided for refs namedbudget - ↑ United States Census Bureau, "Paramount, California Quick Facts," accessed October 10, 2013
- ↑ United States Census Bureau, "Paramount, California Quick Facts," accessed October 10, 2013
- ↑ Cite error: Invalid
<ref>tag; no text was provided for refs namedCensus1 - ↑ California Secretary of State, "Report of Registration as of February 10, 2013 - Registration by County," accessed January 7, 2014
- ↑ Paramount Unified School District, "Dr. Ruth Pérez," accessed July 7, 2016
- ↑ 8.0 8.1 8.2 Wave Newspapers, "Ruth Perez named superintendent of Paramount schools," November 20, 2015
- ↑ Paramount Unified School District, "Herman M. Mendez Appointed as Superintendent for Paramount Unified School District," accessed January 10, 2014
- ↑ Paramount Unified School District, "Board of Education," accessed January 7, 2014
- ↑ Los Angeles County Registrar-Recorder/County Clerk, "2017 Scheduled Elections," accessed June 29, 2017
- ↑ Paramount Unified School District, "Regular Meeting of Board of Education Minutes February 15, 2017," accessed June 29, 2017
- ↑ United States Census Bureau, "Public School System Finances: Historical Data," accessed December 1, 2015
- ↑ Paramount Unified School District, "Agreement between Paramount Unified School District and Paramount Teachers Association CTA/NEA," accessed January 10, 2014
- ↑ Paramount Unified School District, "School Directory," accessed January 7, 2014
- ↑ Ed-Data, "Student Performance - 2012," accessed January 7, 2013
| |||||
