Caddo Parish Public Schools, Louisiana
| Caddo Parish Public Schools |
|---|
| Shreveport, Louisiana |
| District details |
| Superintendent: Dr. Theodis Lamar Goree Jr. |
| # of school board members: 12 partisan |
| Website: Link |
Caddo Parish Public Schools is a school district in Louisiana. In the 2011-2012 school year, Caddo Parish was the third-largest school district in Louisiana and served 41,667 students.[1]
About the district
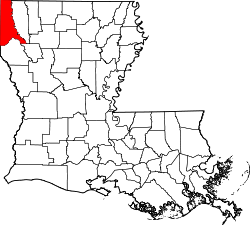
Caddo Parish Public Schools lies in northwestern Louisiana in Caddo Parish. The seat of parish government is Shreveport. Caddo Parish was home to approximately 254,887 residents according to 2013 estimates by the United States Census Bureau.[2]
Demographics
Caddo Parish slightly overperformed compared to the rest of Louisiana in terms of higher education achievement in 2012. The United States Census Bureau found that 22 percent of Caddo Parish residents aged 25 years and older had attained a bachelor's degree compared to 21.4 percent for Louisiana as a whole. The median household income for the parish was $40,497 compared to $44,673 statewide. The poverty rate in the parish was 19.3 percent compared to 18.7 percent for the entire state.[2]
|
| |||||||||||||||||||||||||||||||||||||||||||||
Note: Percentages for race and ethnicity may add up to more than 100 percent because respondents may report more than one race and the Hispanic/Latino ethnicity may be selected in conjunction with any race. Read more about race and ethnicity in the census here.
Superintendent
| |
This information is updated as we become aware of changes. Please contact us with any updates. |
The superintendent of Caddo Parish Public Schools is Dr. Theodis Lamar Goree Jr. He was appointed to the position in October 2013. Prior to this position, Goree had worked as a math teacher in Cobb County School District in Georgia and Fort Worth Independent School District in Texas. He also worked as a principal at Fort Worth and at Mansfield Independent School District. He also served as an assistant superintendent and area superintendent at Mansfield.[4]
Goree earned his B.A. in management from Morehouse College. He earned his master's degree and Ph.D. in educational leadership from the University of Texas at Arlington.[4]
School board elections
Caddo Parish Public Schools is overseen by a school board comprised of 12 partisan members who are elected to represent geographical districts for four-year terms. Note that the partisan affiliation in the table below represents the affiliation which the officeholder held in his or her most recent election
| Caddo Parish School Board | ||||
|---|---|---|---|---|
| Member | District | Partisan Affiliation |
Assumed Office |
Term Ends |
| Steve Riall | District 1 | Republican |
2011 | 2022 |
| Jasmine R. Green | District 2 | Democratic |
2011 | 2022 |
| Lloyd Thompson | District 3 | Democratic |
2018 | 2022 |
| Don Little | District 4 | Republican |
2018 | 2022 |
| Bonita Douzart | District 5 | Democratic |
2015 | 2022 |
| Mary A. Trammel | District 6 | Democratic |
2011 | 2022 |
| Raymond E. Green | District 7 | Democratic |
2015 | 2022 |
| Denee Locke | District 8 | Republican |
2015 | 2022 |
| Barry F. Rachal | District 9 | Republican |
2007 | 2022 |
| Tony Nations | District 10 | Republican |
2018 | 2022 |
| John L. Albritton | District 11 | Democratic |
2015 | 2022 |
| Dottie H. Bell | District 12 | Democratic |
2007 | 2022 |
| |
This officeholder information was last updated on April 30, 2019. Please contact us with any updates. | |
Election dates
The 12 school board members are elected concurrently by district in partisan elections. This means that regular school board elections are held every four years with all eight members being up for re-election at that time. Additionally, all members are elected by a geographically defined district which they represent. Beginning with terms starting January 2015 or later, any member who, at the end of his or her term, has served more than two and one-half terms in the last three consecutive terms cannot be re-elected in the following term. However, they can be re-elected following a one term break. School board candidates in Louisiana are elected by majority vote, which means the winner must receive more than 50 percent of the votes cast. Candidates who are unopposed at the end of a candidate filing period are considered elected as of that date.[5]
Twelve seats were up for general election on November 4, 2014. A runoff election for three seats was held December 6, 2014. The next regular school board election was held in November 2018.
Public participation in board meetings
The Caddo Parish School Board maintains the following policy on public testimony during board meetings on their website:
| “ | How to Address The School Board
IF YOU WISH TO ADDRESS THE SCHOOL BOARD, PLEASE FOLLOW THESE STEPS:
|
” |
| —Caddo Parish Public Schools (2014)[7] | ||
Budget
From 1993 to 2013, the Caddo Parish school district had an average of $357,018,000 in revenue and $357,437,048 in expenditures, according to the United States Census Bureau's survey of school system finances. The district had a yearly average of $73,087,857 in outstanding debt. The district retired $4,561,905 of its debt and issued $8,892,714 in new debt each year on average.[8]
Revenue
The table below separates the district's revenue into the three sources identified by the agency: local, state, and federal.
| Revenue by Source | |||||||||||
|---|---|---|---|---|---|---|---|---|---|---|---|
| Fiscal Year |
Local | State | Federal | Revenue Total | |||||||
| Total | % of Revenue | Total | % of Revenue | Total | % of Revenue | ||||||
| Click [show] on the right to display the revenue data for prior years. | |||||||||||
|---|---|---|---|---|---|---|---|---|---|---|---|
| 1993 | $77,679,000 | 35.80% | $117,671,000 | 54.24% | $21,609,000 | 9.96% | $216,959,000 | ||||
| 1994 | $80,033,000 | 36.06% | $118,757,000 | 53.51% | $23,145,000 | 10.43% | $221,935,000 | ||||
| 1995 | $83,931,000 | 35.81% | $123,739,000 | 52.79% | $26,715,000 | 11.40% | $234,385,000 | ||||
| 1996 | $86,514,000 | 36.45% | $123,377,000 | 51.98% | $27,470,000 | 11.57% | $237,361,000 | ||||
| 1997 | $89,450,000 | 36.22% | $129,290,000 | 52.35% | $28,218,000 | 11.43% | $246,958,000 | ||||
| 1998 | $115,388,000 | 40.45% | $140,664,000 | 49.31% | $29,232,000 | 10.25% | $285,284,000 | ||||
| 1999 | $119,252,000 | 39.94% | $149,970,000 | 50.23% | $29,333,000 | 9.82% | $298,555,000 | ||||
| 2000 | $123,651,000 | 40.05% | $154,561,000 | 50.06% | $30,568,000 | 9.90% | $308,780,000 | ||||
| 2001 | $132,132,000 | 40.92% | $158,906,000 | 49.21% | $31,880,000 | 9.87% | $322,918,000 | ||||
| 2002 | $128,613,000 | 38.95% | $165,071,000 | 49.99% | $36,552,000 | 11.07% | $330,236,000 | ||||
| 2003 | $131,127,000 | 37.91% | $173,038,000 | 50.02% | $41,741,000 | 12.07% | $345,906,000 | ||||
| 2004 | $135,528,000 | 37.02% | $183,261,000 | 50.06% | $47,283,000 | 12.92% | $366,072,000 | ||||
| 2005 | $148,335,000 | 39.37% | $180,753,000 | 47.97% | $47,689,000 | 12.66% | $376,777,000 | ||||
| 2006 | $165,085,000 | 40.70% | $187,599,000 | 46.25% | $52,901,000 | 13.04% | $405,585,000 | ||||
| 2007 | $170,486,000 | 40.67% | $195,268,000 | 46.58% | $53,415,000 | 12.74% | $419,169,000 | ||||
| 2008 | $176,821,000 | 39.47% | $216,580,000 | 48.34% | $54,595,000 | 12.19% | $447,996,000 | ||||
| 2009 | $192,543,000 | 39.24% | $235,325,000 | 47.96% | $62,785,000 | 12.80% | $490,653,000 | ||||
| 2010 | $192,493,000 | 40.23% | $213,750,000 | 44.68% | $72,179,000 | 15.09% | $478,422,000 |
| 2011 | $203,328,000 | 41.67% | $206,617,000 | 42.34% | $77,995,000 | 15.98% | $487,940,000 |
| 2012 | $204,444,000 | 40.61% | $227,474,000 | 45.18% | $71,514,000 | 14.21% | $503,432,000 |
| 2013 | $205,283,000 | 43.49% | $206,001,000 | 43.64% | $60,771,000 | 12.87% | $472,055,000 |
| Avg. | $141,053,143 | 39.10% | $171,793,905 | 48.89% | $44,170,952 | 12.01% | $357,018,000 |
Expenditures
The table below separates the district's expenditures into five categories identified by the agency:
- Instruction: operation expenditures, state payments on behalf of the district for instruction and benefits, and retirement system transfers
- Support Services: support services, food services, and retirement system transfers for support service staff
- Capital Spending: capital outlay expenditures (i.e., construction, land or facilities purchases, and equipment purchases)
- Debt & Gov. Payments: payments to state and local governments and interest on school system debt
- Other: all other non-K-12 programs, except food services
| Expenditures by Category | |||||||||||
|---|---|---|---|---|---|---|---|---|---|---|---|
| Fiscal Year |
Instruction | Support Services | Capital Spending | Debt & Gov. Payments | Other | Budget Total | |||||
| Total | % of Budget | Total | % of Budget | Total | % of Budget | Total | % of Budget | Total | % of Budget | ||
| Click [show] on the right to display the expenditure data for prior years. | |||||||||||
|---|---|---|---|---|---|---|---|---|---|---|---|
| 1993 | $119,195,000 | 56.12% | $81,266,000 | 38.26% | $7,873,000 | 3.71% | $3,207,000 | 1.51% | $860,000 | 0.40% | $212,401,000 |
| 1994 | $125,507,000 | 57.27% | $82,471,000 | 37.63% | $8,852,000 | 4.04% | $1,678,000 | 0.77% | $634,000 | 0.29% | $219,142,000 |
| 1995 | $132,081,000 | 57.07% | $85,121,000 | 36.78% | $11,688,000 | 5.05% | $1,807,000 | 0.78% | $735,000 | 0.32% | $231,432,000 |
| 1996 | $135,412,000 | 57.05% | $88,282,000 | 37.19% | $11,205,000 | 4.72% | $1,602,000 | 0.67% | $854,000 | 0.36% | $237,355,000 |
| 1997 | $141,937,000 | 57.15% | $91,368,000 | 36.79% | $12,674,000 | 5.10% | $1,454,000 | 0.59% | $947,000 | 0.38% | $248,380,000 |
| 1998 | $156,757,000 | 57.45% | $99,434,000 | 36.44% | $14,231,000 | 5.22% | $1,291,000 | 0.47% | $1,153,000 | 0.42% | $272,866,000 |
| 1999 | $163,939,000 | 55.54% | $104,829,000 | 35.51% | $23,485,000 | 7.96% | $1,844,000 | 0.62% | $1,096,000 | 0.37% | $295,193,000 |
| 2000 | $170,855,000 | 54.56% | $107,076,000 | 34.19% | $32,180,000 | 10.28% | $2,019,000 | 0.64% | $1,006,000 | 0.32% | $313,136,000 |
| 2001 | $178,553,000 | 55.55% | $113,215,000 | 35.22% | $25,915,000 | 8.06% | $2,720,000 | 0.85% | $1,009,000 | 0.31% | $321,412,000 |
| 2002 | $193,684,000 | 57.27% | $118,467,000 | 35.03% | $21,779,000 | 6.44% | $3,112,000 | 0.92% | $1,175,000 | 0.35% | $338,217,000 |
| 2003 | $198,522,000 | 56.57% | $125,405,000 | 35.74% | $23,012,000 | 6.56% | $2,749,000 | 0.78% | $1,241,000 | 0.35% | $350,929,000 |
| 2004 | $201,038,000 | 56.01% | $128,782,000 | 35.88% | $25,414,000 | 7.08% | $2,432,000 | 0.68% | $1,241,000 | 0.35% | $358,907,000 |
| 2005 | $206,128,000 | 55.65% | $137,394,000 | 37.09% | $22,623,000 | 6.11% | $2,939,000 | 0.79% | $1,318,000 | 0.36% | $370,402,000 |
| 2006 | $211,422,000 | 52.30% | $149,631,000 | 37.01% | $38,577,000 | 9.54% | $3,331,000 | 0.82% | $1,306,000 | 0.32% | $404,267,000 |
| 2007 | $220,648,000 | 51.82% | $159,689,000 | 37.50% | $39,692,000 | 9.32% | $4,381,000 | 1.03% | $1,426,000 | 0.33% | $425,836,000 |
| 2008 | $239,982,000 | 53.90% | $166,453,000 | 37.38% | $32,447,000 | 7.29% | $5,128,000 | 1.15% | $1,251,000 | 0.28% | $445,261,000 |
| 2009 | $254,255,000 | 53.07% | $180,933,000 | 37.76% | $37,187,000 | 7.76% | $5,558,000 | 1.16% | $1,177,000 | 0.25% | $479,110,000 |
| 2010 | $265,778,000 | 53.38% | $188,835,000 | 37.93% | $33,535,000 | 6.74% | $5,347,000 | 1.07% | $4,376,000 | 0.88% | $497,871,000 |
| 2011 | $265,217,000 | 54.00% | $188,192,000 | 38.32% | $29,285,000 | 5.96% | $5,017,000 | 1.02% | $3,393,000 | 0.69% | $491,104,000 |
| 2012 | $281,104,000 | 54.16% | $198,417,000 | 38.23% | $33,451,000 | 6.45% | $4,923,000 | 0.95% | $1,112,000 | 0.21% | $519,007,000 |
| 2013 | $252,386,000 | 53.25% | $187,754,000 | 39.61% | $28,544,000 | 6.02% | $4,365,000 | 0.92% | $901,000 | 0.19% | $473,950,000 |
| Avg. | $195,923,810 | 55.20% | $132,524,476 | 36.93% | $24,459,476 | 6.64% | $3,185,905 | 0.87% | $1,343,381 | 0.37% | $357,437,048 |
Debt
The table below shows the amount of debt retired, issued, and outstanding in the district for each year.
| Debt | |||
|---|---|---|---|
| Fiscal Year |
Retired | Issued | Outstanding |
| Click [show] on the right to display the debt data for prior years. | |||
|---|---|---|---|
| 1993 | $1,480,000 | $0 | $33,035,000 |
| 1994 | $1,980,000 | $0 | $31,055,000 |
| 1995 | $2,154,000 | $0 | $28,901,000 |
| 1996 | $2,340,000 | $0 | $26,561,000 |
| 1997 | $2,525,000 | $0 | $24,036,000 |
| 1998 | $2,705,000 | $0 | $21,331,000 |
| 1999 | $3,445,000 | $20,000,000 | $37,886,000 |
| 2000 | $3,635,000 | $20,000,000 | $54,251,000 |
| 2001 | $4,170,000 | $8,000,000 | $58,081,000 |
| 2002 | $4,829,000 | $3,500,000 | $56,752,000 |
| 2003 | $5,660,000 | $1,400,000 | $52,492,000 |
| 2004 | $6,335,000 | $6,140,000 | $52,297,000 |
| 2005 | $7,120,000 | $33,860,000 | $79,037,000 |
| 2006 | $3,240,000 | $20,000,000 | $95,797,000 |
| 2007 | $3,645,000 | $20,000,000 | $112,152,000 |
| 2008 | $4,250,000 | $15,781,000 | $123,683,000 |
| 2009 | $5,023,000 | $17,359,000 | $136,019,000 |
| 2010 | $6,725,000 | $0 | $129,294,000 |
| 2011 | $6,998,000 | $0 | $122,296,000 |
| 2012 | $8,576,000 | $20,707,000 | $134,427,000 |
| 2013 | $8,965,000 | $0 | $125,462,000 |
| Avg. | $4,561,905 | $8,892,714 | $73,087,857 |
Teacher salaries
Caddo Parish Public Schools employs over 5,600 staff members, including 101 National Board Certified teachers.[9] Teacher salaries are categorized based on higher education achievement, professional development and years of service. A teacher with a bachelor's degree can earn higher salaries by pursuing graduate courses with raises at credit intervals. The salary schedule also accounts for graduate degrees by providing higher starting salaries and greater potential salaries.
The following table details the salary schedule for Caddo Parish school teachers for the 2014-2015 school year:[10]
| Salary structure | ||
|---|---|---|
| Degree level | Minimum salary ($) | Maximum salary ($) |
| Base salary | 41,967 | 56,198 |
| M.A. | 44,007 | 58,238 |
| M.A. + 30 | 45,027 | 59,258 |
| Specialist | 46,047 | 60,278 |
| Doctorate | 47,067 | 61,298 |
Schools in Caddo Parish Public Schools
Enrollment
Caddo Parish Public Schools served 41,667 students in the 2011-2012 school year. The district does not publicly archive enrollment data.[1]
District schools
Caddo Parish Public Schools operates 70 schools listed below in alphabetical order:
| Caddo Parish Public Schools | ||
|---|---|---|
| School Name | ||
| A. C. Steere | ||
| Alexander Learning Center | ||
| Arthur Circle | ||
| Atkins Technology | ||
| Barret Paideia Academy | ||
| Blanchard | ||
| Booker T. Washington | ||
| Broadmoor Laboratory | ||
| C.E. Byrd | ||
| Caddo Career & Technology Center | ||
| Caddo Heights Math/Science | ||
| Caddo Magnet High | ||
| Caddo Middle Career & Technology | ||
| Caddo Middle Magnet | ||
| Caddo Ombudsman East | ||
| Caddo Ombudsman North | ||
| Caddo Ombudsman South | ||
| Caddo Ombudsman West | ||
| Captain Shreve | ||
| Cherokee Park | ||
| Claiborne Fundamental | ||
| CPSB Adult Education | ||
| Creswell | ||
| Donnie Bickham | ||
| E. B. Williams Stoner Hill | ||
| Eden Gardens Fundamental | ||
| Eighty-First Street ECE | ||
| Fair Park College Prep | ||
| Fairfield Elementary Magnet | ||
| Forest Hill | ||
| Green Oaks Performing Arts | ||
| Herndon Magnet | ||
| Huntington | ||
| J.S. Clark | ||
| Job Corps Opportunity Center | ||
| Judson Fundamental | ||
| Keithville | ||
| Lakeshore | ||
| Midway Prof. Development | ||
| Mooretown Prof. Development | ||
| Mooringsport | ||
| North Caddo Magnet | ||
| North Highlands | ||
| Northside | ||
| Northwood | ||
| Oak Park MicroSociety | ||
| Oil City Magnet | ||
| Pathways in Education | ||
| Pine Grove | ||
| Queensborough | ||
| Ridgewood | ||
| Riverside | ||
| Shreve Island | ||
| Shreveport Academic Recovery 1 | ||
| Shreveport Academic Recovery 2 | ||
| South Highlands Magnet | ||
| Southern Hills | ||
| Southwood | ||
| Summer Grove | ||
| Summerfield | ||
| Sunset Acres | ||
| Timmons, J. P. Elementary | ||
| Turner Elem/6th Grade Academy | ||
| University | ||
| Vivian Elementary/ Middle Magnet | ||
| Walnut Hill | ||
| Werner Park | ||
| Westwood | ||
| Woodlawn Leadership | ||
| Youree Drive Middle Advanced Placement Magnet | ||
Academic performance
Louisiana administers three main sets of tests: DIBELS Next, iLEAP and End-of-Course tests. Additionally, districts are given a letter ranking of A-F based on performance across all grades of students.
DIBELS Next
DIBELS Next is the Dynamic Indicators of Basic Early Literacy Skills test which is administered to K-3 students statewide. The test places students into one of three categories. Those who meet the benchmark levels are placed in the "core" category, indicating they only need core reading curriculum going forward. The other two categories indicate students who need "strategic" or "intensive" intervention in reading education. The following chart outlines the percentage of students in Acadia Parish Schools in each of the categories:[11]
| DIBELS Next results[12] | ||||||||||||
|---|---|---|---|---|---|---|---|---|---|---|---|---|
| Testing date | Kindergarten | 1st grade | 2nd grade | 3rd grade | ||||||||
| Core (%) | Strategic (%) | Intensive (%) | Core (%) | Strategic (%) | Intensive (%) | Core (%) | Strategic (%) | Intensive (%) | Core (%) | Strategic (%) | Intensive (%) | |
| Spring 2013 | 67 | 19 | 14 | 56 | 15 | 29 | 60 | 18 | 22 | 50 | 15 | 34 |
| Fall 2012 | 51 | 20 | 30 | 61 | 14 | 25 | 62 | 11 | 27 | 57 | 11 | 32 |
| Spring 2012 | 62 | 22 | 16 | 54 | 14 | 32 | 52 | 18 | 31 | 44 | 18 | 39 |
| Fall 2011 | 51 | 19 | 31 | 62 | 13 | 24 | 61 | 13 | 26 | 57 | 12 | 31 |
iLEAP and LEAP
Louisiana 3rd through 8th grade students statewide are tested annually in English language arts, mathematics, science and social studies. These tests are called iLEAP and LEAP. On both tests, students can earn the following scores:
| “ |
|
” |
| —Louisiana Department of Education website (2014)[13] | ||
The following table highlights the district's scores for the iLEAP and LEAP in the 2013-2014 school year:
| 'LEAP and iLEAP results, 2013-2014[12] | ||||||||
|---|---|---|---|---|---|---|---|---|
| English: | ||||||||
| 3rd grade | 4th grade | 5th grade | 6th grade | 7th grade | 8th grade | |||
| Advanced (%) | 6 | 5 | 5 | 5 | 7 | 4 | ||
| Mastery (%) | 20 | 23 | 20 | 20 | 15 | 17 | ||
| Basic (%) | 35 | 41 | 40 | 39 | 39 | 36 | ||
| Approaching Basic (%) | 19 | 18 | 22 | 19 | 22 | 30 | ||
| Unsatisfactory (%) | 20 | 13 | 13 | 19 | 16 | 12 | ||
| Math: | ||||||||
| 3rd grade | 4th grade | 5th grade | 6th grade | 7th grade | 8th grade | |||
| Advanced (%) | 10 | 10 | 5 | 7 | 7 | 5 | ||
| Mastery (%) | 16 | 21 | 13 | 12 | 9 | 5 | ||
| Basic (%) | 38 | 35 | 51 | 41 | 46 | 41 | ||
| Approaching Basic (%) | 20 | 16 | 16 | 22 | 18 | 23 | ||
| Unsatisfactory (%) | 17 | 18 | 16 | 18 | 20 | 26 | ||
| Science: | ||||||||
| 3rd grade | 4th grade | 5th grade | 6th grade | 7th grade | 8th grade | |||
| Advanced (%) | 5 | 4 | 4 | 4 | 5 | 3 | ||
| Mastery (%) | 16 | 12 | 15 | 16 | 20 | 15 | ||
| Basic (%) | 38 | 43 | 44 | 36 | 31 | 35 | ||
| Approaching Basic (%) | 24 | 30 | 25 | 29 | 25 | 29 | ||
| Unsatisfactory (%) | 17 | 11 | 12 | 15 | 19 | 18 | ||
| Social studies: | ||||||||
| 3rd grade | 4th grade | 5th grade | 6th grade | 7th grade | 8th grade | |||
| Advanced (%) | 2 | ≤1 | 5 | 9 | 8 | 2 | ||
| Mastery (%) | 14 | 12 | 12 | 14 | 15 | 15 | ||
| Basic (%) | 45 | 47 | 48 | 37 | 36 | 37 | ||
| Approaching Basic (%) | 21 | 24 | 22 | 25 | 23 | 24 | ||
| Unsatisfactory (%) | 19 | 17 | 13 | 15 | 18 | 21 | ||
End-of-course tests
High school students in Louisiana take end-of-course tests in algebra I, geometry, English II and III, biology and U.S. history. The students receive one of the following four scores on each test:
| “ |
|
” |
| —Louisiana Department of Education website (2014)[14] | ||
In the 2013-2014 school year, 53 percent of students taking end-of-course tests across all subjects in the district earned a good or excellent. This was up two percent from 51 percent in 2012-2013.[12]
District letter grade
Louisiana uses a letter grade system of A through F to describe school performance scores. The table on the right outlines the district's letter score by year. The scores are based on the following measurements:
| A-F Letter Grade Results[15] | |||
|---|---|---|---|
| Year | Performance score |
Letter grade | |
| 2014 | 79.4 | C | |
| 2013 | 79.4 | C | |
| “ |
|
” |
Issues
Board term limits
On November 6, 2012, Caddo Parish voters elected by over 67 percent to instate term limits. Terms won in the 2014 election were the first to be affected by the change. Starting with terms that began on or after January 1, 2015, any member who, at the end of his or her term, has served more than two and one-half terms in the last three consecutive terms cannot be re-elected in the following term. However, they can be re-elected following the one term break. The limit does not apply retroactively to incumbents, thus allowing them to potentially serve up to 12 more years.[17][5]
| Parishwide School District Local Option Term Limits Proposition (2012) | ||||
|---|---|---|---|---|
| Result | Votes | Percentage | ||
| 72,982 | 79.03% | |||
| No | 19,362 | 20.97% | ||
Ballot text:
| “ | LOCAL OPTION ELECTION
Within Caddo Parish School District: Shall the number of terms of office that any member of the school board may serve be limited to three consecutive four-year terms?[6] |
” |
| —Louisiana Secretary of State's website (2014)[18] | ||
Contact information
Caddo Parish Public Schools
1961 Midway Avenue
P.O. Box 32000
Shreveport, LA 71130-2000
Phone: 318-603-6300
See also
| Louisiana | School Board Elections | News and Analysis |
|---|---|---|
 |
 | |
External links
- Caddo Parish Public Schools
- Shreveport, Louisiana
- Caddo Parish, Louisiana
- Louisiana Department of Education
- Louisiana School Boards Association (LSBA)
Footnotes
- ↑ 1.0 1.1 National Center for Education Statistics, "ELSI Table Generator," accessed June 17, 2014
- ↑ 2.0 2.1 2.2 United States Census Bureau, "Caddo Parish, Louisiana, Quick Facts," accessed September 3, 2014
- ↑ Louisiana Secretary of State, "Official Results," accessed September 2, 2014
- ↑ 4.0 4.1 Caddo Parish Public Schools, "Superintendent," accessed November 24, 2014
- ↑ 5.0 5.1 Louisiana Secretary of State, "QUALIFICATIONS OF CANDIDATES," accessed September 2, 2014
- ↑ 6.0 6.1 6.2 6.3 6.4 Note: This text is quoted verbatim from the original source. Any inconsistencies are attributable to the original source.
- ↑ Caddo Parish Public Schools, "Caddo Parish School Board," accessed November 24, 2014
- ↑ United States Census Bureau, "Public School System Finances: Historical Data," accessed December 1, 2015
- ↑ Caddo Parish Public Schools, "Mini facts 2014-2015," accessed November 24, 2014
- ↑ Caddo Parish Public Schools, " Caddo Parish School Teacher Salary Schedule," August 2014
- ↑ Louisiana Department of Education, "DIBELS Next," accessed November 24, 2014
- ↑ 12.0 12.1 12.2 Louisiana Department of Education, "Test Results," accessed November 24, 2014
- ↑ Louisiana Department of Education, "Annual Assessments," accessed November 24, 2014
- ↑ Louisiana Department of Education, "End-of-Course Tests," accessed November 24, 2014
- ↑ Louisiana Department of Education, "Performance Scores," accessed November 24, 2014
- ↑ Louisiana Department of Education, "School Letter Grades," accessed November 24, 2014
- ↑ Louisiana Secretary of State, "HOW ARE CANDIDATES ELECTED?" accessed September 2, 2014
- ↑ Louisiana Secretary of State, "Official Election Results," accessed December 4, 2014
| |||||
