Category:Pd-fedgov images
From Ballotpedia
Pages in category "Pd-fedgov images"
The following 3 pages are in this category, out of 3 total.
Media in category "Pd-fedgov images"
The following 200 files are in this category, out of 2,926 total.
(previous page) (next page) 110016Corel WolfMarsh.jpg 432 × 349; 28 KB
 128px-Mark E. Kelly.jpg 128 × 160; 8 KB
 159483main ozone 082706.jpg 718 × 484; 27 KB
 1913 income tax form.jpg 513 × 667; 207 KB
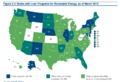
 2015-states-with-renewable-grant-programs.png 1,360 × 788; 446 KB
 2015-states-with-renewable-loan-programs.png 1,394 × 948; 644 KB
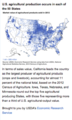
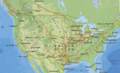 2016 EIA crude oil pipelines map.png 738 × 450; 756 KB
 2016 EIA energy consumption chart.png 717 × 310; 58 KB
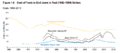 2016 EIA fuel cost chart.png 716 × 315; 55 KB
 2016 EIA import export chart.png 775 × 577; 86 KB
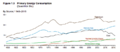
 2016 EIA primary energy production chart.png 1,066 × 473; 106 KB
 2016 Energy consumption by Sector.png 912 × 608; 58 KB
 2016-census-day.jpg 850 × 834; 220 KB
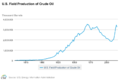 2016CrudeOilProductionEIA.PNG 970 × 647; 39 KB
 203 co2-graph-1280x800.jpg 1,280 × 800; 283 KB
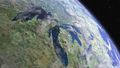 A view of the Great Lakes from space.jpg 3,600 × 2,028; 1.11 MB
 Aaron Schock.jpg 450 × 550; 22 KB
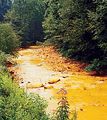 Acid mine drainage.jpg 200 × 225; 19 KB
 Adam Kinzinger.jpg 500 × 753; 59 KB
 Adam Schiff.jpg 450 × 550; 23 KB
 Adam Smith.jpg 500 × 611; 47 KB
 Administration of government.jpg 874 × 851; 135 KB
 Adrian Smith1.jpg 490 × 599; 44 KB
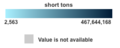 Aggregate coal mine production by state 2015 legend.png 265 × 106; 11 KB
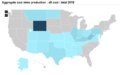 Aggregate coal mine production by state 2015.png 667 × 418; 46 KB
 Aggregate coal mine production for total Annual (2015).png 920 × 613; 29 KB
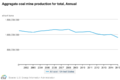 Aggregate coal mine production for total, Annual (1).png 920 × 613; 29 KB
 Agricultural production in 2012 embed.png 350 × 583; 215 KB
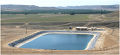 Aguse BenneTerraSystem.jpg 480 × 220; 42 KB
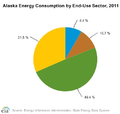 AK energy consumption chart.png 431 × 408; 64 KB
 AK1.jpg 630 × 360; 122 KB
 AKPopShifts.jpg 2,200 × 1,700; 215 KB
 AL energy consumption chart.png 452 × 408; 66 KB
 Al Franken.jpg 1,105 × 1,400; 190 KB
 Al Green.jpg 500 × 767; 69 KB
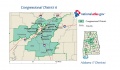
 AL01.jpg 547 × 332; 192 KB
 AL02.jpg 550 × 323; 201 KB
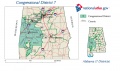
 AL03 110.jpg 594 × 340; 210 KB
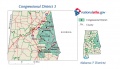
 AL04.jpg 590 × 354; 184 KB
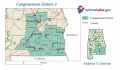
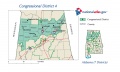
 AL05.jpg 578 × 354; 177 KB
 AL06.jpg 612 × 357; 183 KB
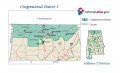
 AL07.jpg 560 × 330; 204 KB
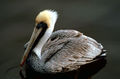 Alabama brown pelican recovered.jpg 697 × 458; 72 KB
 Alabama districts.jpg 469 × 660; 62 KB
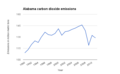 Alabama line CO2.png 600 × 371; 13 KB
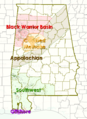 Alabama oil and gas basins.png 413 × 567; 133 KB
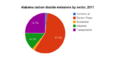 Alabama pie CO2.png 635 × 348; 17 KB
 Alabama state tax revenue, 2014.png 600 × 371; 26 KB
 Alabama's 1st.jpg 237 × 232; 17 KB
 Alabama's 2nd.jpg 342 × 270; 23 KB
 Alabama's 3rd.jpg 201 × 323; 20 KB
 Alabama's 4th.jpg 318 × 245; 23 KB
 Alabama's 5th.jpg 312 × 106; 14 KB
 Alabama's 6th.jpg 188 × 230; 17 KB
 Alabama's 7th.jpg 268 × 339; 25 KB
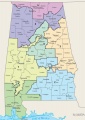
 Alabama-congressional-map-2010.gif 792 × 612; 52 KB
 AlabamaFederalLandsMap.PNG 765 × 587; 117 KB
 Alan Nunnelee.jpg 398 × 599; 49 KB
 Alaska CO2 line.png 600 × 371; 12 KB
 Alaska CO2 pie.png 623 × 371; 18 KB
 Alaska oil and gas production map.png 601 × 464; 100 KB
 Alaska State Seal.gif 543 × 538; 101 KB
 Alaska state tax revenue, 2014.png 600 × 371; 14 KB
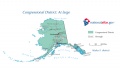
 Alaska-congressional-map-2010.gif 792 × 612; 44 KB
 AlaskaFederalLandsMap1.PNG 762 × 572; 173 KB
 Albio Sires.jpg 357 × 480; 30 KB
 Alcee Hastings.jpg 428 × 525; 76 KB
 Algae growing.png 249 × 428; 185 KB
 Allen West.jpg 500 × 753; 57 KB
 Allison Claire.JPG 375 × 469; 84 KB
 Allyson Schwarz.jpg 675 × 825; 326 KB
 American peregrine falcon.jpg 1,200 × 1,684; 187 KB
 Amy Klobuchar.jpg 500 × 633; 40 KB
 Amy-Klobuchar-circle.png 825 × 975; 410 KB
 Ander Crenshaw.jpg 439 × 527; 71 KB
 Andre Carson.jpg 399 × 600; 45 KB
 Andrew-Puzder-circle.png 413 × 488; 217 KB
 Andy Harris.jpg 200 × 200; 51 KB
 Ann Marie Buerkle.jpg 428 × 599; 35 KB
 Anna Eshoo.jpg 175 × 214; 29 KB
 AnnRavel.jpg 125 × 156; 24 KB
 Anthony Kennedy.jpg 240 × 320; 68 KB
 Anthony Kennedy2.png 800 × 800; 679 KB
 Anthony Weiner.jpg 449 × 548; 69 KB
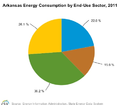 AR energy consumption chart.png 458 × 400; 67 KB
 AR01 110.jpg 564 × 330; 69 KB
 AR02.jpg 552 × 340; 157 KB
 AR03.jpg 557 × 336; 180 KB
 AR04.jpg 554 × 303; 216 KB
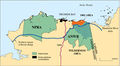 Arctic National Wildlife Refuge (ANWR) reserves.jpg 862 × 476; 227 KB
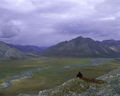 Arctic National Wildlife Refuge.jpg 1,500 × 1,200; 375 KB
 Areas with man-made earthquakes, not due to oil and gas key.png 220 × 214; 28 KB
 Areas with man-made earthquakes, not due to oil and gas.png 605 × 400; 269 KB
 Arizona CO2 line.png 600 × 371; 12 KB
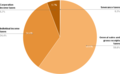
 Arizona CO2 pie.png 619 × 371; 17 KB
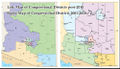
 Arizona districts.jpg 555 × 652; 46 KB
 Arizona SCOTUS.jpg 998 × 570; 218 KB
 Arizona state tax revenue, 2014.png 600 × 371; 22 KB
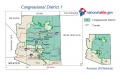
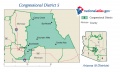
 Arizona's 1st.jpg 467 × 543; 33 KB
 Arizona's 2nd.jpg 206 × 143; 12 KB
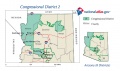
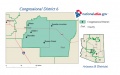
 Arizona's 3rd.jpg 436 × 272; 24 KB
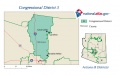
 Arizona's 4th.jpg 383 × 506; 28 KB
 Arizona's 5th.jpg 208 × 170; 15 KB
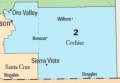
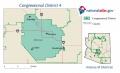
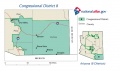
 Arizona's 6th.jpg 353 × 219; 20 KB
 Arizona's 7th.jpg 186 × 144; 15 KB
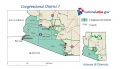
 Arizona's 8th.jpg 226 × 262; 19 KB
 Arizona's 9th.jpg 166 × 203; 17 KB
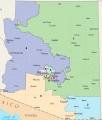
 Arizona-congressional-map-2010.gif 792 × 612; 48 KB
 Arkansas CO2 line.png 600 × 371; 12 KB
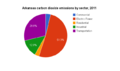 Arkansas CO2 pie.png 631 × 371; 18 KB
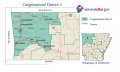
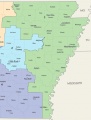
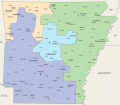 Arkansas districts.JPG 754 × 661; 62 KB
 Arkansas state tax revenue, 2014.png 600 × 371; 25 KB
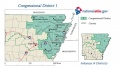
 Arkansas's 1st.JPG 501 × 658; 44 KB
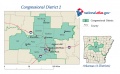
 Arkansas's 2nd.JPG 322 × 273; 20 KB
 Arkansas's 3rd.JPG 330 × 276; 21 KB
 Arkansas's 4th.JPG 492 × 615; 43 KB
 Arkansas-congressional-map-2010.gif 792 × 612; 56 KB
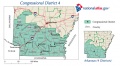
 ArkansasFederalLandsMap.PNG 813 × 606; 174 KB
 Austin scott.jpg 500 × 754; 42 KB
 Average Application for Permit to Drill wait times 2014.png 770 × 566; 174 KB
 Average cost to drill a well in the U.S., 2014.png 512 × 345; 47 KB
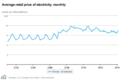
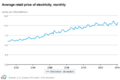
 Average electricity prices in Alabama.png 920 × 613; 40 KB
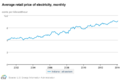
 Average electricity prices in Alaska.png 920 × 613; 38 KB
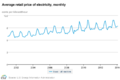
 Average electricity prices in Arizona.png 920 × 613; 42 KB
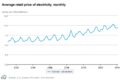
 Average electricity prices in Arkansas.png 920 × 613; 40 KB
 Average electricity prices in California.png 920 × 613; 42 KB
 Average electricity prices in Colorado.png 920 × 613; 39 KB
 Average electricity prices in Connecticut.png 920 × 613; 35 KB
 Average electricity prices in Delaware.png 920 × 613; 37 KB
 Average electricity prices in Florida.png 920 × 613; 35 KB
 Average electricity prices in Georgia.png 920 × 613; 42 KB
 Average electricity prices in Hawaii.png 920 × 613; 38 KB
 Average electricity prices in Idaho.png 920 × 613; 37 KB
 Average electricity prices in Illinois.png 920 × 613; 39 KB
 Average electricity prices in Indiana.png 920 × 613; 35 KB
 Average electricity prices in Iowa.png 920 × 613; 42 KB
 Average electricity prices in Kansas.png 920 × 613; 40 KB
 Average electricity prices in Kentucky.png 920 × 613; 40 KB
 Average electricity prices in Louisiana.png 920 × 613; 43 KB
 Average electricity prices in Maine.png 920 × 613; 40 KB
 Average electricity prices in Maryland.png 920 × 613; 40 KB
 Average electricity prices in Massachusetts.png 920 × 613; 42 KB
 Average electricity prices in Michigan.png 920 × 613; 38 KB
 Average electricity prices in Minnesota.png 920 × 613; 40 KB
 Average electricity prices in Mississippi.png 920 × 613; 38 KB
 Average electricity prices in Missouri.png 920 × 613; 44 KB
 Average electricity prices in Montana.png 920 × 613; 36 KB
 Average electricity prices in Nebraska.png 920 × 613; 43 KB
 Average electricity prices in Nevada.png 920 × 613; 44 KB
 Average electricity prices in New Hampshire.png 920 × 613; 37 KB
 Average electricity prices in New Jersey.png 920 × 613; 42 KB
 Average electricity prices in New Mexico.png 920 × 613; 41 KB
 Average electricity prices in New York.png 920 × 613; 42 KB
 Average electricity prices in North Carolina.png 920 × 613; 37 KB
 Average electricity prices in North Dakota.png 920 × 613; 40 KB
 Average electricity prices in Ohio.png 920 × 613; 37 KB
 Average electricity prices in Oklahoma.png 920 × 613; 46 KB
 Average electricity prices in Oregon.png 920 × 613; 35 KB
 Average electricity prices in Pennsylvania.png 920 × 613; 38 KB
 Average electricity prices in Rhode Island.png 920 × 613; 43 KB
 Average electricity prices in South Carolina.png 920 × 613; 39 KB
 Average electricity prices in South Dakota.png 920 × 613; 39 KB
 Average electricity prices in Tennessee.png 920 × 613; 34 KB
 Average electricity prices in Texas.png 920 × 613; 39 KB
 Average electricity prices in Utah.png 920 × 613; 40 KB
 Average electricity prices in Vermont.png 920 × 613; 31 KB
 Average electricity prices in Virginia.png 920 × 613; 37 KB
 Average electricity prices in Washington.png 920 × 613; 34 KB
 Average electricity prices in West Virginia.png 920 × 613; 34 KB
 Average electricity prices in Wisconsin.png 920 × 613; 38 KB
 Average electricity prices in Wyoming.png 950 × 429; 42 KB
 Average water used in the U.S., 2010.png 600 × 371; 30 KB
 AZ energy consumption chart.png 441 × 408; 70 KB
 AZ01.jpg 539 × 345; 170 KB
 AZ02.jpg 557 × 330; 167 KB
 AZ03.jpg 554 × 345; 136 KB
 AZ04.jpg 529 × 323; 130 KB
 AZ05.jpg 548 × 329; 146 KB
 AZ06.jpg 571 × 358; 126 KB
 AZ07.jpg 569 × 327; 156 KB
 AZ08.jpg 572 × 338; 132 KB
 Azel, Texas earthquake epicenters Nov 2013.png 426 × 362; 348 KB
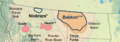 Bakken and Three Forks North Dakota Map 2017.png 1,021 × 359; 709 KB
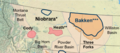 Bakken Formation Montana map 2017.png 1,748 × 770; 2.14 MB
 Barbara Boxer.jpg 2,368 × 3,000; 1,012 KB
 Barbara Lee.JPG 486 × 599; 52 KB
 Barbara Mikulski.jpg 500 × 628; 44 KB
 Barbara-A-McAuliffe.png 420 × 525; 284 KB
 Barney Frank.jpg 1,955 × 3,011; 912 KB
 Barry M Kurren.jpg 409 × 504; 41 KB
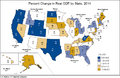 BEA percent change real GDP, 2014.png 948 × 617; 125 KB
 Becky Skillman.JPEG 494 × 600; 47 KB
 Ben Bernanke 2013.jpg 175 × 201; 11 KB
 Ben Cardin.jpg 2,891 × 3,779; 2.74 MB
 Ben Chandler.jpg 500 × 607; 39 KB
 Ben Nelson.jpg 473 × 599; 61 KB
 Ben Ray Lujan.jpg 398 × 599; 38 KB
 Benjamin Quayle.JPG 399 × 600; 34 KB
 Bennie Thompson.jpg 450 × 550; 128 KB


.png)
.png)


_reserves.jpg)


