Michigan's 7th Congressional District

Michigan's 7th Congressional District in the United States House of Representatives is represented by Tom Barrett (R).
As of the 2020 Census, Michigan representatives represented an average of 775,726 residents. After the 2010 Census, each member represented 707,973 residents.
Elections
See also: Michigan's 7th Congressional District election, 2030
There are no official candidates yet for this election.
See also: Michigan's 7th Congressional District election, 2028
There are no official candidates yet for this election.
See also: Michigan's 7th Congressional District election, 2026
General election
The primary will occur on August 4, 2026. The general election will occur on November 3, 2026. General election candidates will be added here following the primary.
Democratic primary
Democratic primary for U.S. House Michigan District 7
The following candidates are running in the Democratic primary for U.S. House Michigan District 7 on August 4, 2026.
Candidate | ||
 | Elyon Badger | |
 | Bridget Brink | |
| Josh Cowen | ||
 | William Lawrence | |
 | Matt Maasdam | |
 | Alexandra Prieditis | |
 | Muhammad Salman Rais | |

| ||||
| If you are a candidate and would like to tell readers and voters more about why they should vote for you, complete the Ballotpedia Candidate Connection Survey. | ||||
Do you want a spreadsheet of this type of data? Contact our sales team. | ||||
Republican primary
Republican primary for U.S. House Michigan District 7
Incumbent Tom Barrett (R) is running in the Republican primary for U.S. House Michigan District 7 on August 4, 2026.
Candidate | ||
 | Tom Barrett | |
| ||||
| If you are a candidate and would like to tell readers and voters more about why they should vote for you, complete the Ballotpedia Candidate Connection Survey. | ||||
Do you want a spreadsheet of this type of data? Contact our sales team. | ||||
See also: Michigan's 7th Congressional District election, 2024
General election
General election for U.S. House Michigan District 7
Tom Barrett (R) defeated Curtis Hertel (D) and L. Rachel Dailey (L) in the general election for U.S. House Michigan District 7 on November 5, 2024.
Candidate | % | Votes | ||
| ✔ | | Tom Barrett (R) | 50.3 | 226,722 |
 | Curtis Hertel (D) | 46.6 | 209,959 | |
 | L. Rachel Dailey (L) | 3.2 | 14,231 | |
| Total votes: 450,912 | |||
| If you are a candidate and would like to tell readers and voters more about why they should vote for you, complete the Ballotpedia Candidate Connection Survey. | ||||
Do you want a spreadsheet of this type of data? Contact our sales team. | ||||
Democratic primary
Democratic primary for U.S. House Michigan District 7
Curtis Hertel (D) advanced from the Democratic primary for U.S. House Michigan District 7 on August 6, 2024.
Candidate | % | Votes | ||
| ✔ | | Curtis Hertel | 100.0 | 72,083 |
| Total votes: 72,083 | |||
| If you are a candidate and would like to tell readers and voters more about why they should vote for you, complete the Ballotpedia Candidate Connection Survey. | ||||
Do you want a spreadsheet of this type of data? Contact our sales team. | ||||
Republican primary
Republican primary for U.S. House Michigan District 7
Tom Barrett (R) advanced from the Republican primary for U.S. House Michigan District 7 on August 6, 2024.
Candidate | % | Votes | ||
| ✔ | | Tom Barrett | 100.0 | 63,399 |
| Total votes: 63,399 | |||
| If you are a candidate and would like to tell readers and voters more about why they should vote for you, complete the Ballotpedia Candidate Connection Survey. | ||||
Do you want a spreadsheet of this type of data? Contact our sales team. | ||||
Libertarian Party convention
Libertarian convention for U.S. House Michigan District 7
L. Rachel Dailey (L) advanced from the Libertarian Party convention for U.S. House Michigan District 7 on July 20, 2024.
Candidate | ||
| ✔ | | L. Rachel Dailey |
| ||||
| If you are a candidate and would like to tell readers and voters more about why they should vote for you, complete the Ballotpedia Candidate Connection Survey. | ||||
Do you want a spreadsheet of this type of data? Contact our sales team. | ||||
See also: Michigan's 7th Congressional District election, 2022
General election
General election for U.S. House Michigan District 7
Incumbent Elissa Slotkin (D) defeated Tom Barrett (R) and L. Rachel Dailey (L) in the general election for U.S. House Michigan District 7 on November 8, 2022.
Candidate | % | Votes | ||
| ✔ |  | Elissa Slotkin (D) | 51.7 | 192,809 |
| | Tom Barrett (R) | 46.3 | 172,624 | |
| | L. Rachel Dailey (L) | 2.0 | 7,275 | |
| Total votes: 372,708 | |||
| If you are a candidate and would like to tell readers and voters more about why they should vote for you, complete the Ballotpedia Candidate Connection Survey. | ||||
Do you want a spreadsheet of this type of data? Contact our sales team. | ||||
Democratic primary
Democratic primary for U.S. House Michigan District 7
Incumbent Elissa Slotkin (D) advanced from the Democratic primary for U.S. House Michigan District 7 on August 2, 2022.
Candidate | % | Votes | ||
| ✔ | | Elissa Slotkin | 100.0 | 77,826 |
| Total votes: 77,826 | |||
| If you are a candidate and would like to tell readers and voters more about why they should vote for you, complete the Ballotpedia Candidate Connection Survey. | ||||
Do you want a spreadsheet of this type of data? Contact our sales team. | ||||
Republican primary
Republican primary for U.S. House Michigan District 7
Tom Barrett (R) defeated Jacob Hagg (R) in the Republican primary for U.S. House Michigan District 7 on August 2, 2022.
Candidate | % | Votes | ||
| ✔ | | Tom Barrett | 96.0 | 75,491 |
 | Jacob Hagg (Write-in) | 4.0 | 3,108 | |
| Total votes: 78,599 | |||
| If you are a candidate and would like to tell readers and voters more about why they should vote for you, complete the Ballotpedia Candidate Connection Survey. | ||||
Do you want a spreadsheet of this type of data? Contact our sales team. | ||||
Libertarian Party convention
Libertarian convention for U.S. House Michigan District 7
L. Rachel Dailey (L) advanced from the Libertarian Party convention for U.S. House Michigan District 7 on July 10, 2022.
Candidate | ||
| ✔ | | L. Rachel Dailey |
| ||||
| If you are a candidate and would like to tell readers and voters more about why they should vote for you, complete the Ballotpedia Candidate Connection Survey. | ||||
Do you want a spreadsheet of this type of data? Contact our sales team. | ||||
See also: Michigan's 7th Congressional District election, 2020
General election
General election for U.S. House Michigan District 7
Incumbent Tim Walberg (R) defeated Gretchen Driskell (D) in the general election for U.S. House Michigan District 7 on November 3, 2020.
Candidate | % | Votes | ||
| ✔ |  | Tim Walberg (R) | 58.8 | 227,524 |
 | Gretchen Driskell (D) | 41.2 | 159,743 | |
| Total votes: 387,267 | |||
| If you are a candidate and would like to tell readers and voters more about why they should vote for you, complete the Ballotpedia Candidate Connection Survey. | ||||
Do you want a spreadsheet of this type of data? Contact our sales team. | ||||
Democratic primary
Democratic primary for U.S. House Michigan District 7
Gretchen Driskell (D) advanced from the Democratic primary for U.S. House Michigan District 7 on August 4, 2020.
Candidate | % | Votes | ||
| ✔ | | Gretchen Driskell | 100.0 | 63,470 |
| Total votes: 63,470 | |||
| If you are a candidate and would like to tell readers and voters more about why they should vote for you, complete the Ballotpedia Candidate Connection Survey. | ||||
Do you want a spreadsheet of this type of data? Contact our sales team. | ||||
Withdrawn or disqualified candidates
- Samuel Branscum (D)
- Ryan William Hall (D)
- Samuel Larson (D)
- C.B. Smith (D)
Republican primary
Republican primary for U.S. House Michigan District 7
Incumbent Tim Walberg (R) advanced from the Republican primary for U.S. House Michigan District 7 on August 4, 2020.
Candidate | % | Votes | ||
| ✔ | | Tim Walberg | 100.0 | 84,397 |
| Total votes: 84,397 | |||
| If you are a candidate and would like to tell readers and voters more about why they should vote for you, complete the Ballotpedia Candidate Connection Survey. | ||||
Do you want a spreadsheet of this type of data? Contact our sales team. | ||||
Withdrawn or disqualified candidates
- Bruce Gidner (R)
See also: United States House of Representatives elections in Michigan, 2018
General election
General election for U.S. House Michigan District 7
Incumbent Tim Walberg (R) defeated Gretchen Driskell (D) in the general election for U.S. House Michigan District 7 on November 6, 2018.
Candidate | % | Votes | ||
| ✔ | | Tim Walberg (R) | 53.8 | 158,730 |
| | Gretchen Driskell (D) | 46.2 | 136,330 | |
| Total votes: 295,060 | |||
| If you are a candidate and would like to tell readers and voters more about why they should vote for you, complete the Ballotpedia Candidate Connection Survey. | ||||
Do you want a spreadsheet of this type of data? Contact our sales team. | ||||
Democratic primary
Democratic primary for U.S. House Michigan District 7
Gretchen Driskell (D) defeated Steven Friday (D) in the Democratic primary for U.S. House Michigan District 7 on August 7, 2018.
Candidate | % | Votes | ||
| ✔ | | Gretchen Driskell | 85.2 | 52,430 |
 | Steven Friday | 14.8 | 9,083 | |
| Total votes: 61,513 | |||
| If you are a candidate and would like to tell readers and voters more about why they should vote for you, complete the Ballotpedia Candidate Connection Survey. | ||||
Do you want a spreadsheet of this type of data? Contact our sales team. | ||||
Republican primary
Republican primary for U.S. House Michigan District 7
Incumbent Tim Walberg (R) advanced from the Republican primary for U.S. House Michigan District 7 on August 7, 2018.
Candidate | % | Votes | ||
| ✔ | | Tim Walberg | 100.0 | 69,248 |
| Total votes: 69,248 | |||
| If you are a candidate and would like to tell readers and voters more about why they should vote for you, complete the Ballotpedia Candidate Connection Survey. | ||||
Do you want a spreadsheet of this type of data? Contact our sales team. | ||||
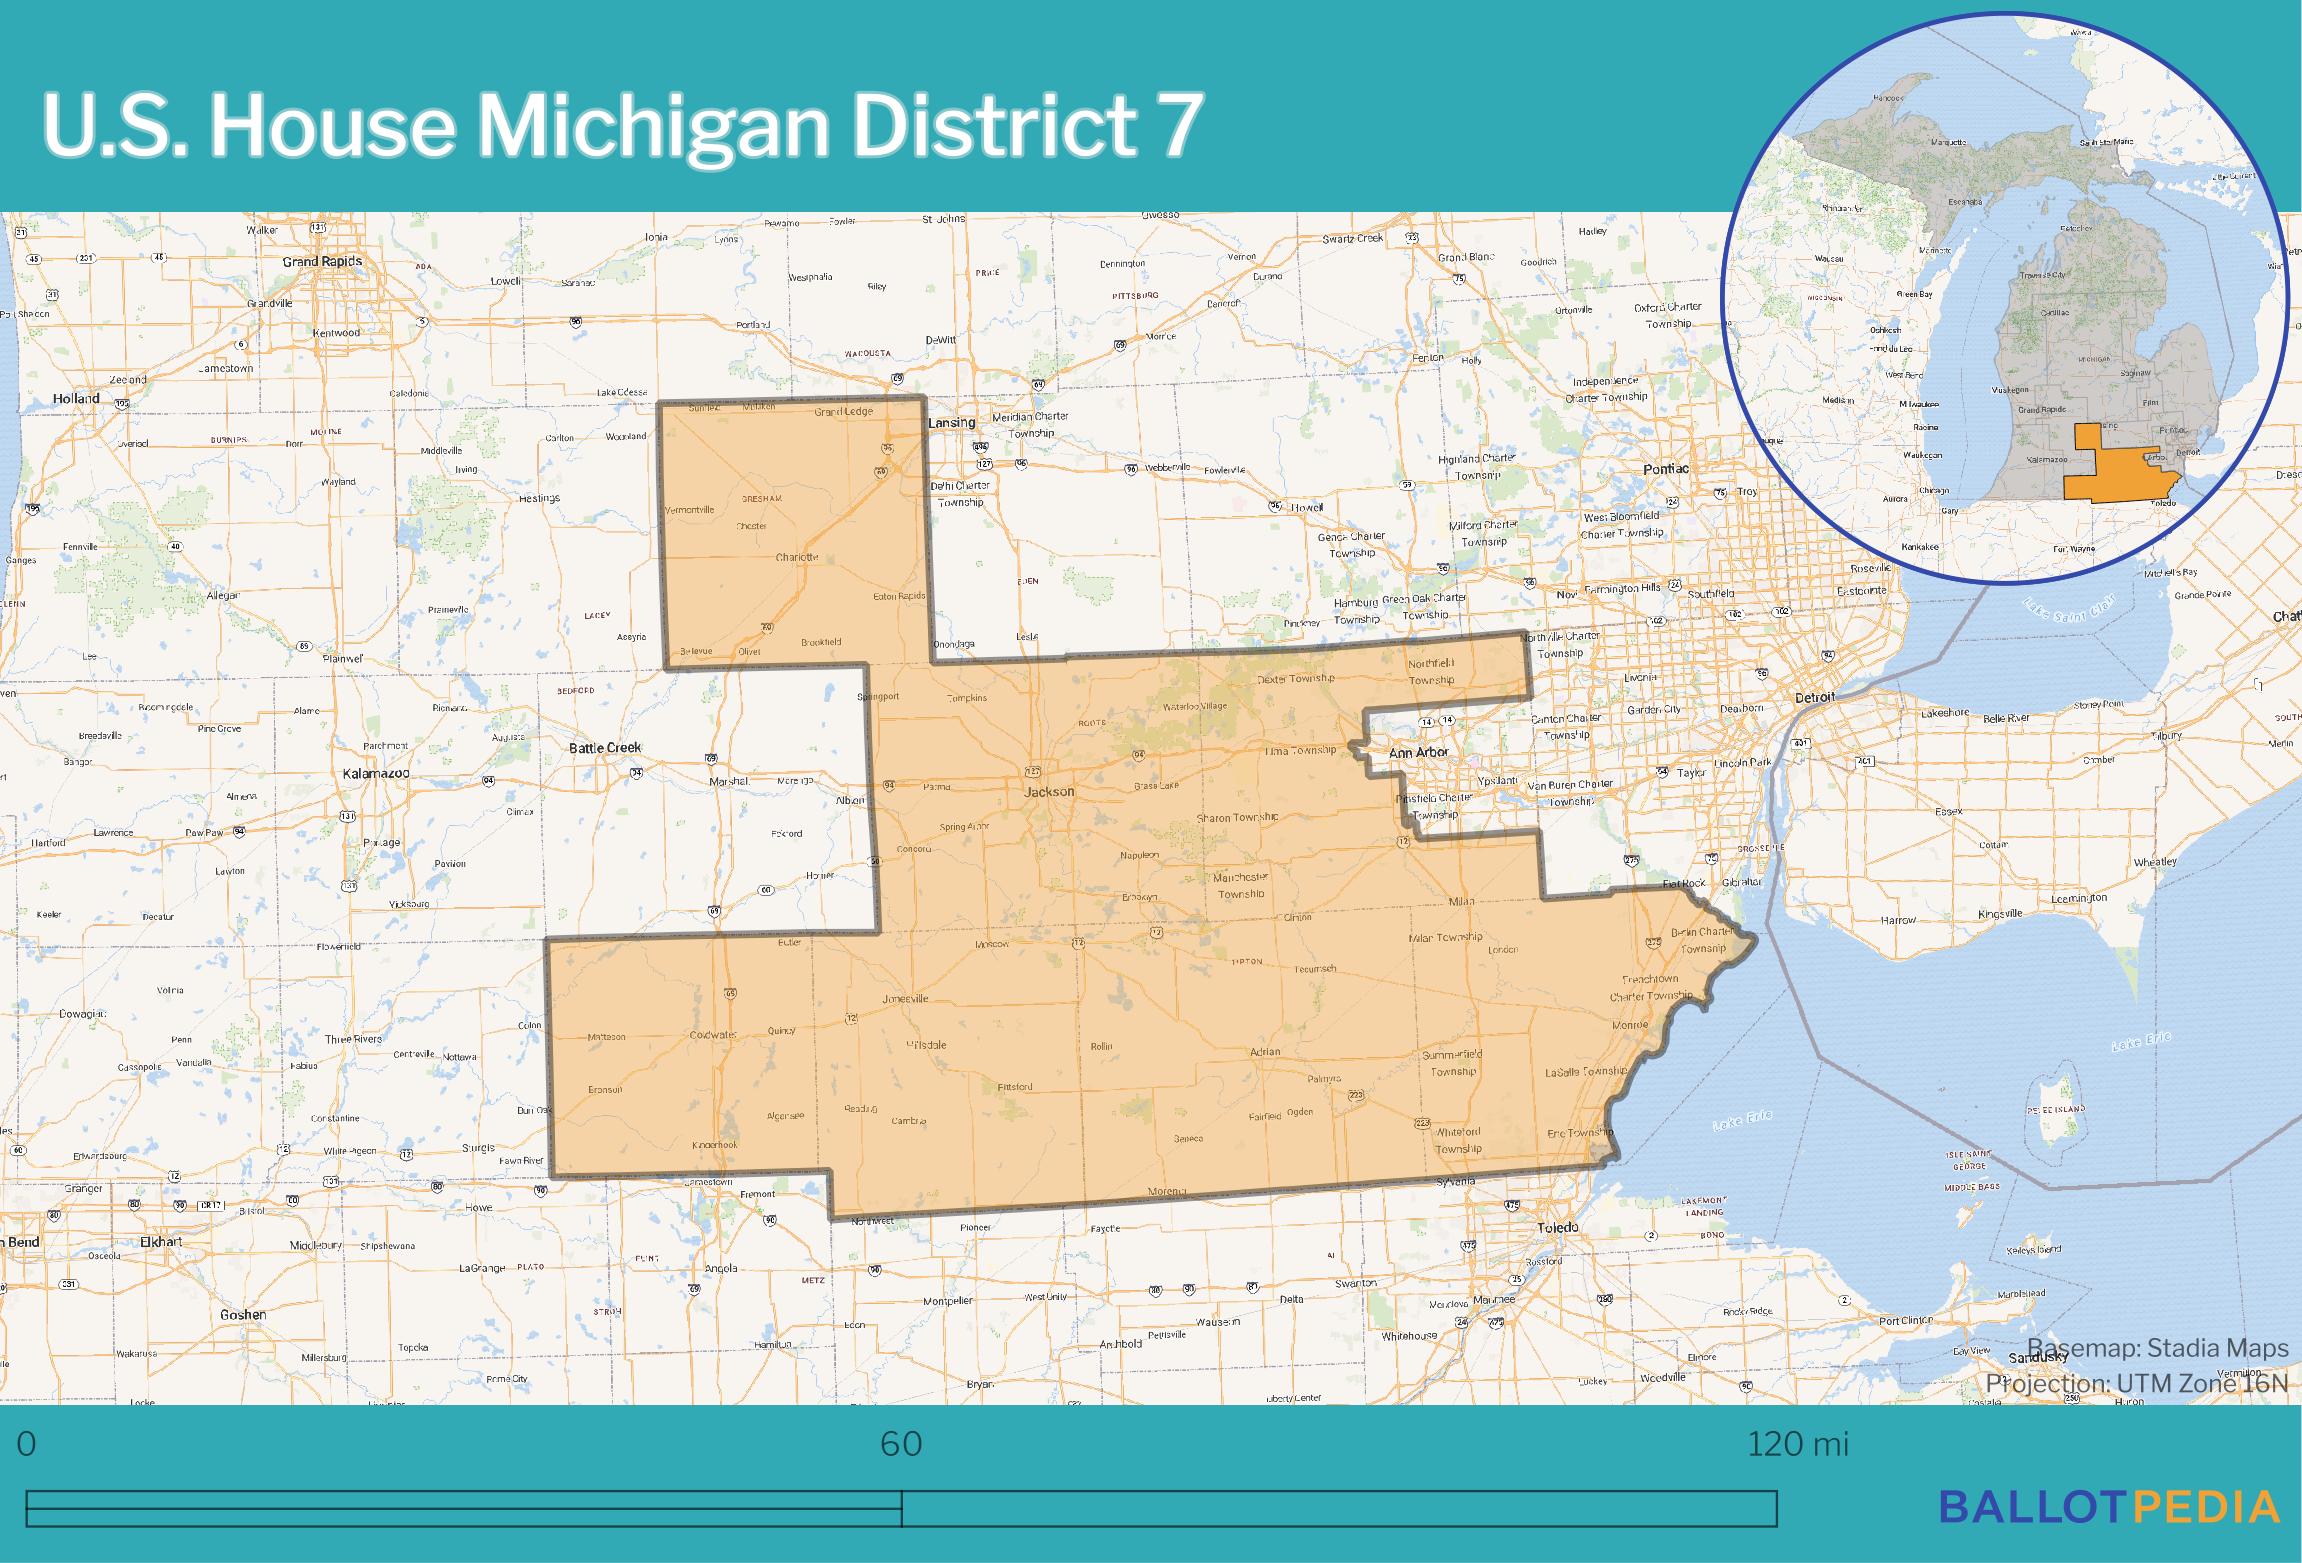
District map

Redistricting
2020-2021
Michigan’s congressional district boundaries became law on March 26, 2022, 60 days after the Michigan Independent Citizens Redistricting Commission (MICRC) published its report on the redistricting plans with the secretary of state.[17][18] On December 28, 2021, the Michigan Independent Citizens Redistricting Commission (MICRC) approved what was named the "Chestnut" map by a vote of 8-5. Two Democrats, two Republicans, and four nonpartisan members voted to approve the plan with the five remaining commissioners in favor of other plans. As required, "at least two commissioners who affiliate with each major party, and at least two commissioners who do not affiliate with either major party" voted in favor of the adopted map.[19]
The MICRC was established after voters approved a 2018 constitutional amendment that transferred the power to draw the state's congressional and legislative districts from the state legislature to a redistricting commission. Under the terms of the amendment, "Within 30 days after adopting a plan, the commission shall publish the plan and the material reports, reference materials, and data used in drawing it, including any programming information used to produce and test the plan." The adopted plan becomes law 60 days after the MICRC publishes that report.[19]
Beth LeBlanc of The Detroit News wrote that, “Unlike other congressional maps the commission had to choose from, Chestnut was set apart by its inclusion of Grand Rapids and Muskegon in the same district, its grouping of Battle Creek and Kalamazoo and its ability to keep Jackson County whole, instead of breaking off part of the county into an Ann Arbor area district.”[20] According to Clara Hendrickson and Todd Spangler of the Detroit Free Press, "According to three measures of partisan fairness based on statewide election data from the past decade, the map favors Republicans. But those measures also show a significant reduction in the Republican bias compared to the map drawn a decade ago by a Republican legislature, deemed one of the most politically biased maps in the country. One of the partisan fairness measures used by the commission indicates Democratic candidates would have an advantage under the new map."[21] This map took effect for Michigan’s 2022 congressional elections.
How does redistricting in Michigan work? In Michigan, a non-politician commission is responsible for drawing both congressional and state legislative district plans. The commission comprises 13 members, including four Democrats, four Republicans, and five unaffiliated voters or members of minor parties. In order for a map to be enacted, at least seven members must vote for it, including at least two Democrats, two Republicans, and two members not affiliated with either major party.[22]
The Michigan Independent Citizens Redistricting Commission prepared this document specifically explaining the redistricting process after the 2020 census.
2020
2024
2010-2011

In 2011, the Michigan State Legislature re-drew the congressional districts based on updated population information from the 2010 census.
In redistricting, The Hill published a list of the Top Ten House Members who were helped by redistricting.[23] Tim Walberg ranked 6th on the list.[23] The article notes that Tim Walberg lost the district to centrist Mark Schauer (D) in 2008. He then beat Schauer in a rematch by 5 points in 2010. The redistricting process, controlled by Republicans, made sure to cut Schauer’s home base out of the district and made it a few points more Republican.[23] According to the article, Schauer said that he would not run for a rematch because of the new map.[23]
District analysis
- See also: The Cook Political Report's Partisan Voter Index
- See also: FiveThirtyEight's elasticity scores
2026
Heading into the 2026 elections, based on results from the 2024 and 2020 presidential elections, the Cook Partisan Voter Index for this district is EVEN. This meant that in those two presidential elections, this district's results were about the same as the national average. This made Michigan's 7th the 220th most Republican district nationally.[24]
2024
Heading into the 2024 elections, based on results from the 2020 and 2016 presidential elections, the Cook Partisan Voter Index for this district was R+2. This meant that in those two presidential elections, this district's results were 2 percentage points more Republican than the national average. This made Michigan's 7th the 211th most Republican district nationally.[25]
Daily Kos calculated what the results of the 2020 presidential election in this district would have been following redistricting. Joe Biden (D) would have defeated Donald Trump (R) 49.4%-48.9%.[26]
2022
Heading into the 2022 elections, based on results from the 2020 and 2016 presidential elections, the Cook Partisan Voter Index for this district was R+2. This meant that in those two presidential elections, this district's results were 2 percentage points more Republican than the national average. This made Michigan's 7th the 210th most Republican district nationally.[27]
Daily Kos calculated what the results of the 2020 presidential election in this district would have been following redistricting. Joe Biden (D) would have received 49.4% of the vote in this district and Donald Trump (R) would have received 48.9%.[28]
2018
Heading into the 2018 elections, based on results from the 2016 and 2012 presidential elections, the Cook Partisan Voter Index for this district was R+7. This meant that in those two presidential elections, this district's results were 7 percentage points more Republican than the national average. This made Michigan's 7th Congressional District the 176th most Republican nationally.[29]
FiveThirtyEight's September 2018 elasticity score for states and congressional districts measured "how sensitive it is to changes in the national political environment." This district's elasticity score was 1.12. This means that for every 1 point the national political mood moved toward a party, the district was expected to move 1.12 points toward that party.[30]
See also
- Redistricting in Michigan
- Michigan's 7th Congressional District election, 2026
- Michigan's 7th Congressional District election, 2024
- Michigan's 7th Congressional District election, 2022
- Michigan's 7th Congressional District election, 2020
- Michigan's 7th Congressional District election, 2018
External links
Footnotes
- ↑ Michigan Secretary of State, "2016 Michigan Candidate Listing," accessed April 20, 2016
- ↑ Politico, "Michigan House Primaries Results," August 2, 2016
- ↑ Michigan Secretary of State, "2016 Michigan Candidate Listing," accessed September 6, 2016
- ↑ CNN, "Election Results," accessed November 8, 2016
- ↑ Politico, "2012 Election Map, Michigan," accessed November 3, 2012
- ↑ U.S. Congress House Clerk, "Statistics of the Congressional Election of November 2, 2010," accessed March 28, 2013
- ↑ U.S. Congress House Clerk, "Statistics of the Congressional Election of November 4, 2008," accessed March 28, 2013
- ↑ U.S. Congress House Clerk, "Statistics of the Congressional Election of November 7, 2006," accessed March 28, 2013
- ↑ U.S. Congress House Clerk, "Statistics of the Congressional Election of November 2, 2004," accessed March 28, 2013
- ↑ U.S. Congress House Clerk, "Statistics of the Congressional Election of November 5, 2002," accessed March 28, 2013
- ↑ U.S. Congress House Clerk, "Statistics of the Congressional Election of November 7, 2000," accessed March 28, 2013
- ↑ U.S. Congress House Clerk, "Statistics of the Congressional Election of November 3, 1998," accessed March 28, 2013
- ↑ U.S. Congress House Clerk, "Statistics of the Congressional Election of November 5, 1996," accessed March 28, 2013
- ↑ U.S. Congress House Clerk, "Statistics of the Congressional Election of November 8, 1994," accessed March 28, 2013
- ↑ U.S. Congress House Clerk, "Statistics of the Congressional Election of November 3, 1992," accessed March 28, 2013
- ↑ U.S. Congress House Clerk, "Statistics of the Congressional Election of November 6, 1990," accessed March 28, 2013
- ↑ Cite error: Invalid
<ref>tag; no text was provided for refs namedmarch26 - ↑ Cite error: Invalid
<ref>tag; no text was provided for refs namedMICRCemail - ↑ 19.0 19.1 Cite error: Invalid
<ref>tag; no text was provided for refs namedMIConst - ↑ The Detroit News, "Michigan redistricting panel wraps adoption of state House, Senate, congressional maps" December 28, 2021
- ↑ Detroit Free Press, "Michigan's redistricting commission adopts final congressional map for the next decade" December 28, 2021
- ↑ Michigan Radio, "Redistricting proposal passes in Michigan," November 6, 2018
- ↑ 23.0 23.1 23.2 23.3 The Hill, "House members most helped by redistricting," accessed April 17, 2012
- ↑ Cook Political Report, "2025 Cook PVI℠: District Map and List (119th Congress)," accessed July 1, 2025
- ↑ Cook Political Report, "The 2022 Cook Partisan Voting Index (Cook PVI℠)," accessed January 10, 2024
- ↑ Daily Kos, "Daily Kos Elections' 2020 presidential results by congressional district, for new and old districts," accessed September 15, 2022
- ↑ Cook Political Report, "The 2022 Cook Partisan Voting Index (Cook PVI℠)," accessed February 6, 2023
- ↑ Daily Kos, "Daily Kos Elections' 2020 presidential results by congressional district, for new and old districts," accessed September 15, 2022
- ↑ Cook Political Report, "Introducing the 2017 Cook Political Report Partisan Voter Index," April 7, 2017
- ↑ FiveThirtyEight, "Election Update: The Most (And Least) Elastic States And Districts," September 6, 2018
