Pension health by state, 2010
This article does not receive scheduled updates. If you would like to help our coverage grow, consider donating to Ballotpedia. Contact our team to suggest an update.
State and local pension plans are underfunded across the United States. Experts estimate that there is a more than $4.4 trillion shortfall. The 50 states release analysis each year of their pension health, which is defined by the percent funded ratio of the plan.[1]
According to the Pew Center on the States Widening Gap report, most experts agree that a fiscally sustainable system should be at least 80 percent funded.[2] As of 2012, only 12 states meet that criteria.
State comparisons
| Percent funded status of pension plans in the 50 states as of November 2013 |
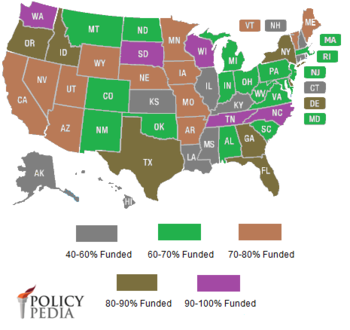 |
| Note: The data in this map was compiled from state CAFR reports and Actuarial Valuation documents. Figures reflect a combination of all of the state pension plans. |
Figures below are based upon the official CAFR and Acturial Valuation Reports from 2012. Data was last checked in November 2013.
| Pension Health by State | ||
|---|---|---|
| State | Percent Funded | Percent Funded Rank |
| Alabama | 66.2% | 30 |
| Alaska | 54.7% | 47 |
| Arizona | 71.9% | 21 |
| Arkansas | 71% | 22 |
| California | 77.48% | 18 |
| Colorado | 64.22% | 36 |
| Connecticut | 50.61% | 48 |
| Delaware | 88.34% | 6 |
| Florida | 86.38% | 8 |
| Georgia | 82.43% | 11 |
| Hawaii | 59.2% | 42 |
| Idaho | 84.68% | 9 |
| Illinois | 47.86% | 50 |
| Indiana | 60.8% | 41 |
| Iowa | 79.1% | 14 |
| Kansas | 56.4% | 44 |
| Kentucky | 49.86% | 49 |
| Louisiana | 55.86% | 46 |
| Maine | 79.1% | 15 |
| Maryland | 64.37% | 34 |
| Massachusetts | 66.36% | 29 |
| Michigan | 65.86% | 31 |
| Minnesota | 75% | 20 |
| Mississippi | 57.89% | 43 |
| Missouri | 78.2% | 17 |
| Montana | 66.75% | 28 |
| Nebraska | 78.9% | 16 |
| Nevada | 70.97% | 23 |
| New Hampshire | 56.2% | 45 |
| New Jersey | 64.54% | 33 |
| New Mexico | 63.14% | 39 |
| New York | 88.21% | 7 |
| North Carolina | 95.26% | 2 |
| North Dakota | 63.46% | 38 |
| Ohio | 67.35% | 27 |
| Oklahoma | 64.92% | 32 |
| Oregon | 82% | 12 |
| Pennsylvania | 64.37% | 35 |
| Rhode Island | 61.16% | 40 |
| South Carolina | 67.8% | 26 |
| South Dakota | 92.6% | 4 |
| Tennessee | 91.54% | 5 |
| Texas | 83.14% | 10 |
| Utah | 76.49% | 19 |
| Vermont | 70.16% | 24 |
| Virginia | 69.46% | 25 |
| Washington | 93.07% | 3 |
| West Virginia | 64.16% | 37 |
| Wisconsin | 99.9% | 1 |
| Wyoming | 79.62% | 13 |
See also
Footnotes
