Scott Rasmussen's Number of the Day for April 19, 2017
The Number of the Day columns published on Ballotpedia reflect the views of the author.
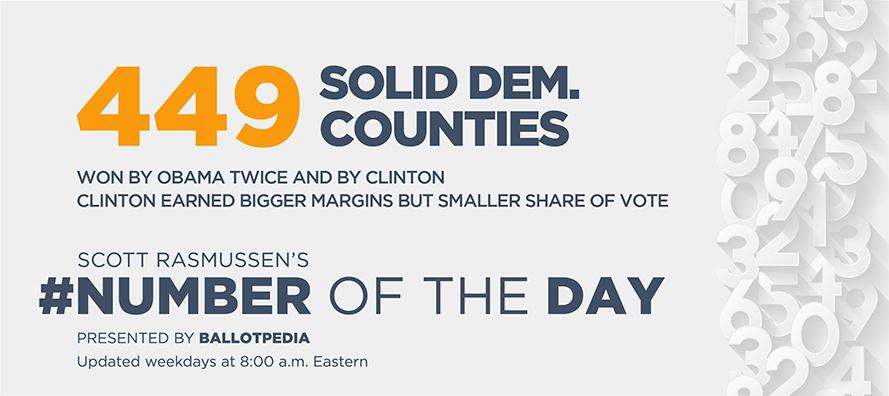
April 19, 2017: There are 449 U.S. counties that swung solidly Democratic in the 2008, 2012, and 2016 presidential elections. These counties were won by Barack Obama in 2008 and 2012 and went on to be won by Hillary Clinton four years later (see map below). Data released earlier showed that 206 Pivot Counties voted twice for President Obama but flipped to vote for Donald Trump in 2016 (see more research on Pivot Counties here).
One notable thing about these counties is that they are much larger by population than most. They recorded an average of 153,779 votes—more than four times the 36,533 votes cast in the average Pivot County. Overall, among all counties in the nation, the average number of votes was 44,027.[1]
Clinton carried the solidly Democratic counties by 20.0 million votes in her unsuccessful bid for the White House. That’s slightly larger than Obama’s margins of victory in 2008 (18.8 million votes) and 2012 (17.5 million votes).
| 449 Democratic counties | 2016 (Clinton) | 2012 (Obama) | 2008 (Obama) |
| Democratic margin of victory (# of votes) | 19,967,074 | 17,529,381 | 18,833,731 |
At first glance, this larger margin of victory might suggest that Clinton generated more enthusiasm than Obama in these solidly Democratic counties. But a closer look challenges that perspective. Clinton won just 61.5 percent of the total vote in these counties. That’s down from the 62.6 percent share earned by Obama in 2012 and his 63.5 percent share in 2008.
So, with a smaller share of the vote, how did Clinton rack up bigger vote totals? Part of the explanation is that more votes were cast than in earlier years. These 449 counties recorded 69 million voters in 2016, up from 65 million in 2012 and 66 million in 2016.
But Hillary Clinton didn’t pick up these extra votes. While the number of total votes grew by 2.7 million from 2008, Clinton captured only 12 percent of that growth. She earned just 320,840 more votes than Obama did eight years earlier.
The big factor in Clinton winning bigger margins is that support for the Republican nominee fell sharply in these Democratic counties during 2016. Donald Trump won just 32.6 percent of the vote in these counties. That’s down from the 35.7 percent earned by Mitt Romney in 2012 and 35.1 percent earned by John McCain in 2008. Had Trump earned as much support in these counties as either Romney or McCain, the margins run up by Clinton in these solidly Democratic counties would have been much smaller that Obama’s.
| 449 Democratic counties | 2016 | 2012 | 2008 |
|---|---|---|---|
| Democratic vote share | 61.50% | 62.60% | 63.50% |
| Republican vote share | 32.60% | 35.70% | 35.10% |
| Third-party vote share | 6.00% | 1.70% | 1.40% |
| Source: Dave Leip of Atlas of U.S. Presidential Elections | |||
In effect, Clinton racked up larger margins in Democratic counties because many opposing voters refused to vote for the Republican nominee. Instead, they cast a third-party vote. In these counties, 6.0 percent of voters chose the third-party option. That’s up from 1.7 percent in 2012 and 1.4 percent in 2008.
These county totals for third-party votes are very similar to the national average.
- April 18, 2017 70 billion dollars: Annual spending on federal regulatory agencies
- April 17, 2017 29.6 billion dollars spent annually on tax preparation fees and software
- April 14, 2017 70 years ago this weekend, Jackie Robinson broke the Major League color barrier
- April 13, 2017 261 million: Visits to IRS website in 2017
- To see other recent numbers, check out the archive.
Scott Rasmussen’s Number of the Day is published by Ballotpedia weekdays at 8:00 a.m. Eastern. Click here to check out the latest update.
The Number of the Day is broadcast on local stations across the country. An archive of these broadcasts can be found here.
Columns published on Ballotpedia reflect the views of the author.
Ballotpedia is the nonprofit, nonpartisan Encyclopedia of American Politics.
See also
- Scott Rasmussen's Number of the Day
- Pivot Counties: The counties that voted Obama-Obama-Trump from 2008-2016
- Presidential election, 2016
Footnotes
- ↑ The raw data for this study was provided by Dave Leip of Atlas of U.S. Presidential Elections.
| |||||||||||||||||||||||


