Scott Rasmussen's Number of the Day for March 26, 2018
The Number of the Day columns published on Ballotpedia reflect the views of the author.
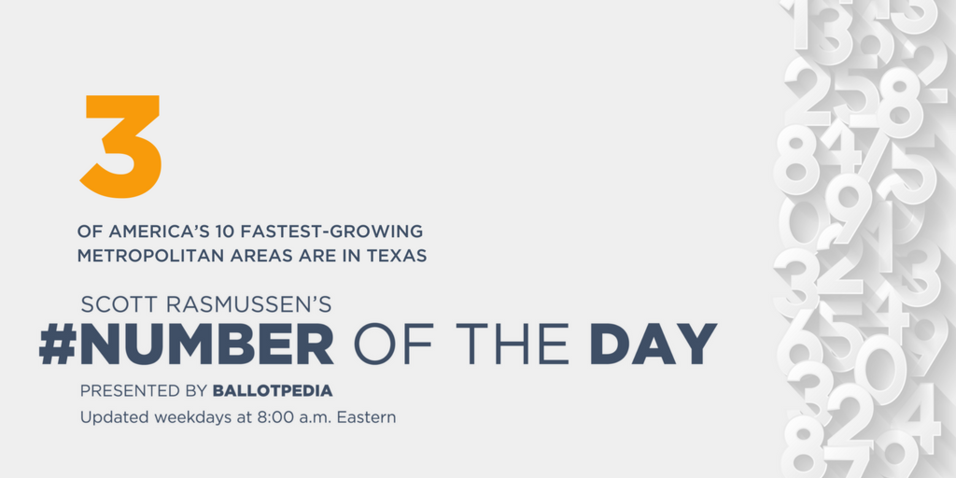
March 26, 2018: Three of America’s 10 fastest-growing metropolitan areas are in Texas.
The Dallas-Fort Worth-Arlington area was number one, adding 146,238 residents in 2017. Census Bureau data shows that the Houston area posted the second-largest growth while Austin was number nine.[1]
Florida placed two metropolitan areas on the top 10 list. Orlando showed the eighth-highest level of growth while Tampa-St. Petersburg came in 10th.
| Top 10 Largest-Gaining Metropolitan Areas (Numeric Increase): 2016-2017 | |||||
|---|---|---|---|---|---|
| 1 | 1 | Dallas-Fort Worth-Arlington, TX | 7,399,662 | 7,253,424 | 146,238 |
| 2 | 2 | Houston-The Woodlands-Sugar Land, TX | 6,892,427 | 6,798,010 | 94,417 |
| 3 | 3 | Atlanta-Sandy Springs-Roswell, GA | 5,884,736 | 5,795,723 | 89,013 |
| 4 | 4 | Phoenix-Mesa-Scottsdale, AZ | 4,737,270 | 4,648,498 | 88,772 |
| 5 | 11 | Washington-Arlington-Alexandria, DC-VA-MD-WV | 6,216,589 | 6,150,681 | 65,908 |
| 6 | 6 | Seattle-Tacoma-Bellevue, WA | 3,867,046 | 3,802,660 | 64,386 |
| 7 | 13 | Riverside-San Bernardino-Ontario, CA | 4,580,670 | 4,523,653 | 57,017 |
| 8 | 8 | Orlando-Kissimmee-Sanford, FL | 2,509,831 | 2,453,333 | 56,498 |
| 9 | 9 | Austin-Round Rock, TX | 2,115,827 | 2,060,558 | 55,269 |
| 10 | 7 | Tampa-St. Petersburg-Clearwater, FL | 3,091,399 | 3,036,525 | 54,874 |
A slightly different measure showed similar results. All 10 of the fastest-growing counties were in the South and West. Six were in Texas and one each in Arizona, Nevada, California, and Washington.
According to the U.S. Census Bureau, “The primary driver behind the growth of the 10 fastest-growing counties, 2016-2017, was net domestic migration”—in other words, people moving into these other markets from other places in the U.S.
In contrast, the counties losing the most population were Cook County, Illinois (Chicago); Baltimore, Maryland; and Cuyahoga County, Ohio (Cleveland).
| Top 10 Largest-Gaining Counties (Numeric Increase): 2016-2017 | ||||||
|---|---|---|---|---|---|---|
| 1 | 1 | Maricopa County, AZ | 4,307,033 | 4,233,383 | 73,650 | 1.7 |
| 2 | 3 | Clark County, NV | 2,204,079 | 2,156,724 | 47,355 | 2.2 |
| 3 | 6 | Riverside County, CA | 2,423,266 | 2,386,522 | 36,744 | 1.5 |
| 4 | 2 | Harris County, TX | 4,652,980 | 4,617,041 | 35,939 | 0.8 |
| 5 | 5 | Tarrant County, TX | 2,054,475 | 2,021,746 | 32,729 | 1.6 |
| 6 | 4 | King County, WA | 2,188,649 | 2,155,962 | 32,687 | 1.5 |
| 7 | 8 | Bexar County, TX | 1,958,578 | 1,927,747 | 30,831 | 1.6 |
| 8 | 7 | Dallas County, TX | 2,618,148 | 2,587,462 | 30,686 | 1.2 |
| 9 | 12 | Denton County, TX | 836,210 | 808,299 | 27,911 | 3.5 |
| 10 | 14 | Collin County, TX | 969,603 | 942,453 | 27,150 | 2.9 |
Each weekday, Scott Rasmussen’s Number of the Day explores interesting and newsworthy topics at the intersection of culture, politics, and technology.
- March 23, 2018 – 28 Republican seats in Congress at high risk in November
- March 22, 2018 – 3.2 billion dollars earned by independent creators on YouTube
- March 21, 2018 – 18 percent of American adults have listened to an audiobook
- March 20, 2018 – 16 percent of Americans have tried cocaine
- March 19, 2018 – 17 years until seniors outnumber children in U.S.
- To see other recent numbers, check out the archive.
Scott Rasmussen’s Number of the Day is published by Ballotpedia weekdays at 8:00 a.m. Eastern. Click here to check out the latest update.
The Number of the Day is broadcast on local stations across the country. An archive of these broadcasts can be found here.
Columns published on Ballotpedia reflect the views of the author.
Ballotpedia is the nonprofit, nonpartisan Encyclopedia of American Politics.
See also
Footnotes
| |||||||||||||||||||||||


