T.J. Prendergast III: Difference between revisions
No edit summary |
m (Replaced Polinfobox / Judge Infobox with APIWidget) |
||
| Line 1: | Line 1: | ||
<APIWidget where="person.id = '95514'" template="Polinfobox" />{{tnr}}'''T.J. Prendergast III''' is the District 2 representative on the South Orange County Community College District in [[California]]. Prendergast's current term expires in 2018. | |||
==About the county== | ==About the county== | ||
Revision as of 06:11, 29 January 2018
T.J. Prendergast III is the District 2 representative on the South Orange County Community College District in California. Prendergast's current term expires in 2018.
About the county
- See also: Orange County, California
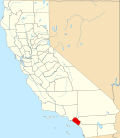
The county government of Orange County is located in Santa Ana, California. The county was first established in 1889. It covers a total of 790.5 square miles in southern California.[1]As of 2020, its population was 3,186,989.
County government
- See also: Government of Orange County, California
Orange County is overseen by a five-member board of supervisors. Each supervisor is elected by district to a four-year term. Residents also elect a county assessor, county auditor, county clerk-recorder, district attorney, county sheriff-coroner, and county treasurer-tax collector.
Demographics
The following table displays demographic data provided by the United States Census Bureau.
| Demographic Data for Orange County, California | ||
|---|---|---|
| Orange County | California | |
| Population | 3,186,989 | 39,538,223 |
| Land area (sq mi) | 792 | 155,858 |
| Race and ethnicity** | ||
| White | 46.4% | 44% |
| Black/African American | 1.6% | 5.5% |
| Asian | 21.9% | 15.3% |
| Native American | 0.8% | 1.1% |
| Pacific Islander | 3.2% | 1.2% |
| Other (single race) | 14.1% | 17.4% |
| Multiple | 14.9% | 16.3% |
| Hispanic/Latino | 34.1% | 39.8% |
| Education | ||
| High school graduation rate | 86.9% | 84.6% |
| College graduation rate | 43.4% | 36.5% |
| Income | ||
| Median household income | $113,702 | $96,334 |
| Persons below poverty level | 9.5% | 12% |
| Source: population provided by U.S. Census Bureau, "Decennial Census" (2020). Other figures provided by U.S. Census Bureau, "American Community Survey" (5-year estimates 2018-2023). | ||
| **Note: Percentages for race and ethnicity may add up to more than 100 percent because respondents may report more than one race and the Hispanic/Latino ethnicity may be selected in conjunction with any race. Read more about race and ethnicity in the census here. | ||
See also
| Orange County, California | California | Municipal government | Other local coverage |
|---|---|---|---|
 |
 |
 |
 |
External links
Footnotes

