Become part of the movement for unbiased, accessible election information. Donate today.
Billings Public Schools elections (2016)
← 2015 |
|---|
|
|
| Enrollment (13–14): |
|
|
Three of the nine seats on the Billings Public Schools Board of Education were up for general election on May 3, 2016. Incumbents Greta Besch Moen and Rob Rogers filed for re-election to Districts 3 and 5, respectively, and were unopposed in the race. Joining them was newcomer Joseph Oravecz, who also ran unopposed for the District 7 seat.[1] There was no primary. All three candidates, Moen, Rogers, and Oravecz, won seats on the school board. They were sworn in on May 16, 2016.
Elections
Voter and candidate information
The Billings Public Schools Board of Education consists of nine members elected to three-year terms by specific geographic district. There is no primary election, and the general election for three seats was held on May 3, 2016. Four seats were up for election in 2015.
School board candidates had to file with their county elections department during the candidate filing period, which began on December 10, 2015, and ended on March 24, 2016. To vote in the 2016 general election, residents had to register by April 4, 2016. In-person-only late registration began on April 5, 2016.[2]
Candidates and results
District 3
Results
Candidates
| Greta Besch Moen | |
|---|---|
|
|
|
District 5
Results
Candidates
| Rob Rogers | |
|---|---|
|
|
|

District 7
Results
Candidates
| Joseph Oravecz | |
|---|---|
|
|
|

Additional elections on the ballot
This election shared the ballot with a general election for fire district trustees.[3]
Key deadlines
The following dates are key deadlines for Montana school board elections in 2016:[3]
| Deadline | Event |
|---|---|
| March 24, 2016 | Candidate filing deadline |
| April 4, 2016 | Close of voter registration |
| April 13, 2016 | Absentee ballots available (walk-in only) |
| April 15, 2016 | Absentee ballots mailed |
| May 3, 2016 | Election Day, pre-general campaign finance deadline |
Endorsements
Do you know of an official or organization that endorsed a candidate in this race? Let Ballotpedia know by email at editor@ballotpedia.org.
Past elections
Information about earlier elections can be found by clicking [show] at the right. | |||||||||||||||||||||||||||||||||||||||||||||||||||||||||||||||||||||||||||||||||||||||||||||||||||||||||||||||||||||||||||||||||||||||||||||||||||||||||||||||||||||||||||||||||||||||||||||||||||||||||||||||||||||||||||||||||||||||||||||||||||||||||||||||||||||||||||||||
|---|---|---|---|---|---|---|---|---|---|---|---|---|---|---|---|---|---|---|---|---|---|---|---|---|---|---|---|---|---|---|---|---|---|---|---|---|---|---|---|---|---|---|---|---|---|---|---|---|---|---|---|---|---|---|---|---|---|---|---|---|---|---|---|---|---|---|---|---|---|---|---|---|---|---|---|---|---|---|---|---|---|---|---|---|---|---|---|---|---|---|---|---|---|---|---|---|---|---|---|---|---|---|---|---|---|---|---|---|---|---|---|---|---|---|---|---|---|---|---|---|---|---|---|---|---|---|---|---|---|---|---|---|---|---|---|---|---|---|---|---|---|---|---|---|---|---|---|---|---|---|---|---|---|---|---|---|---|---|---|---|---|---|---|---|---|---|---|---|---|---|---|---|---|---|---|---|---|---|---|---|---|---|---|---|---|---|---|---|---|---|---|---|---|---|---|---|---|---|---|---|---|---|---|---|---|---|---|---|---|---|---|---|---|---|---|---|---|---|---|---|---|---|---|---|---|---|---|---|---|---|---|---|---|---|---|---|---|---|---|---|---|---|---|---|---|---|---|---|---|---|---|---|---|---|---|---|---|---|---|---|---|---|---|---|---|---|---|---|---|---|---|
2015
District 4Incumbent Joseph Raffiani ran unopposed and won the District 4 seat by default. District 5Incumbent Rob Rogers ran unopposed and won the District 5 seat with an unexpired one-year term by default. District 6Newcomer Mike Leo ran unopposed and won the District 6 seat by default. High School District A
2014
District 1Tanya Ludwig ran unopposed and won the District 1 seat by default without an election.
District 2
High School District B
2013District 3
District 5
District 7
2012District 4
District 6
High School District A
| |||||||||||||||||||||||||||||||||||||||||||||||||||||||||||||||||||||||||||||||||||||||||||||||||||||||||||||||||||||||||||||||||||||||||||||||||||||||||||||||||||||||||||||||||||||||||||||||||||||||||||||||||||||||||||||||||||||||||||||||||||||||||||||||||||||||||||||||
What was at stake?
Report a story for this election
Ballotpedia researches issues in school board elections across the United States, but information availability is a challenge for us in many school districts. Please contact us about the issues that impact your local school district. Note that not all submissions may meet Ballotpedia's coverage requirements for inclusion.
Candidate survey
|
|
Ballotpedia invites school board candidates to participate in its annual survey. |
About the district
- See also: Billings Public Schools, Montana
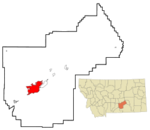
Billings Public Schools is located in Yellowstone County, Montana. The county seat is Billings. Billings was home to 108,869 residents in 2014, according to the United States Census Bureau.[4] The district was the largest school district in the state in the 2013–2014 school year and served 11,244 students.[5]
Demographics
Billings outperformed in comparison to Montana as a whole in terms of higher education achievement from 2010 to 2014. The United States Census Bureau found that 30.5 percent of Billings residents aged 25 years and older had attained a bachelor's degree, compared to 29.1 percent for Montana as a whole. The median household income in the city was $49,265, compared to $46,766 for the state. The poverty rate in the city was 13.8 percent, compared to 15.4 percent for the state.[4]
|
| |||||||||||||||||||||||||||||||||||||||||||||
Note: Percentages for race and ethnicity may add up to more than 100 percent because respondents may report more than one race and the Hispanic/Latino ethnicity may be selected in conjunction with any race. Read more about race and ethnicity in the census here.
Recent news
The link below is to the most recent stories in a Google news search for the terms 'Billings Public Schools' 'Montana'. These results are automatically generated from Google. Ballotpedia does not curate or endorse these articles.
See also
| Billings Public Schools | Montana | School Boards |
|---|---|---|
 |
||
External links
Footnotes
- ↑ Yellowstone County, "Election Candidates: School District # 2," accessed March 28, 2016
- ↑ Yellowstone County, "Election Information," accessed April 6, 2016
- ↑ 3.0 3.1 Yellowstone County, "2016 Election Dates & Filing Information," accessed April 6, 2016
- ↑ 4.0 4.1 4.2 United States Census Bureau, "Billings, Montana," accessed April 6, 2016
- ↑ National Center for Education Statistics, "ELSI Table Generator," accessed November 16, 2015
- ↑ Montana Secretary of State, "Official Election Results," accessed May 7, 2014
| 2016 Billings Public Schools Elections | |
| Election date: | May 3, 2016 |
| Candidates: | District 3: Incumbent, Greta Besch Moen District 5: Incumbent, Rob Rogers |
| Important information: | What was at stake? • Key deadlines • Additional elections on the ballot |
