Caddo Parish Public Schools, Louisiana
| Caddo Parish Public Schools |
|---|
| Shreveport, Louisiana |
| District details |
| Superintendent: T. Lamar Goree |
| # of school board members: 12 |
| Website: Link |
Caddo Parish Public Schools is a school district in Louisiana.
Click on the links below to learn more about the school district's...
- Superintendent
- School board
- Elections
- Budget
- Teacher salaries
- Academic performance
- Student enrollment
- Demographics
- Contact information
Superintendent
| |
This information is updated as we become aware of changes. Please contact us with any updates. |
Theodis Lamar Goree is the superintendent of Caddo Parish Public Schools. Goree was appointed superintendent in December 2013. Goree's previous career experience includes working as the area superintendent of the Mansfield Independent School District in Texas and as a mathematics teacher.[1]
School board elections
Caddo Parish Public Schools consists of 12 members elected to four-year terms. Board members are elected by district in partisan elections.
| Office | Name | Date assumed office |
|---|
| |
This officeholder information was last updated on April 16, 2021. Please contact us with any updates. | |
Election dates
All 12 seats on the Caddo Parish Parish School Board are up for election in November every four years.[2]
Twelve seats were up for election on November 6, 2018. The District 3 and District 8 seats were up for special election on November 3, 2020. The District 7 seat was up for special election on October 9, 2021.
Louisiana elections use the Louisiana majority-vote system. All candidates compete in the same primary, and a candidate can win the election outright by receiving more than 50% of the vote. If no candidate does, the top two vote recipients from the primary advance to the general election, regardless of their partisan affiliation.
For information about which offices are nominated via primary election, see this article.
Public participation in board meetings
The Caddo Parish School Board maintains the following policy on public testimony during board meetings on their website:
| “ | How to Address The School Board
IF YOU WISH TO ADDRESS THE SCHOOL BOARD, PLEASE FOLLOW THESE STEPS:
|
” |
| —Caddo Parish Public Schools (2014)[4] | ||
Budget
From 1993 to 2013, the Caddo Parish school district had an average of $357,018,000 in revenue and $357,437,048 in expenditures, according to the United States Census Bureau's survey of school system finances. The district had a yearly average of $73,087,857 in outstanding debt. The district retired $4,561,905 of its debt and issued $8,892,714 in new debt each year on average.[5]
Revenue
The table below separates the district's revenue into the three sources identified by the agency: local, state, and federal.
| Revenue by Source | |||||||||||
|---|---|---|---|---|---|---|---|---|---|---|---|
| Fiscal Year |
Local | State | Federal | Revenue Total | |||||||
| Total | % of Revenue | Total | % of Revenue | Total | % of Revenue | ||||||
| Click [show] on the right to display the revenue data for prior years. | |||||||||||
|---|---|---|---|---|---|---|---|---|---|---|---|
| 1993 | $77,679,000 | 35.80% | $117,671,000 | 54.24% | $21,609,000 | 9.96% | $216,959,000 | ||||
| 1994 | $80,033,000 | 36.06% | $118,757,000 | 53.51% | $23,145,000 | 10.43% | $221,935,000 | ||||
| 1995 | $83,931,000 | 35.81% | $123,739,000 | 52.79% | $26,715,000 | 11.40% | $234,385,000 | ||||
| 1996 | $86,514,000 | 36.45% | $123,377,000 | 51.98% | $27,470,000 | 11.57% | $237,361,000 | ||||
| 1997 | $89,450,000 | 36.22% | $129,290,000 | 52.35% | $28,218,000 | 11.43% | $246,958,000 | ||||
| 1998 | $115,388,000 | 40.45% | $140,664,000 | 49.31% | $29,232,000 | 10.25% | $285,284,000 | ||||
| 1999 | $119,252,000 | 39.94% | $149,970,000 | 50.23% | $29,333,000 | 9.82% | $298,555,000 | ||||
| 2000 | $123,651,000 | 40.05% | $154,561,000 | 50.06% | $30,568,000 | 9.90% | $308,780,000 | ||||
| 2001 | $132,132,000 | 40.92% | $158,906,000 | 49.21% | $31,880,000 | 9.87% | $322,918,000 | ||||
| 2002 | $128,613,000 | 38.95% | $165,071,000 | 49.99% | $36,552,000 | 11.07% | $330,236,000 | ||||
| 2003 | $131,127,000 | 37.91% | $173,038,000 | 50.02% | $41,741,000 | 12.07% | $345,906,000 | ||||
| 2004 | $135,528,000 | 37.02% | $183,261,000 | 50.06% | $47,283,000 | 12.92% | $366,072,000 | ||||
| 2005 | $148,335,000 | 39.37% | $180,753,000 | 47.97% | $47,689,000 | 12.66% | $376,777,000 | ||||
| 2006 | $165,085,000 | 40.70% | $187,599,000 | 46.25% | $52,901,000 | 13.04% | $405,585,000 | ||||
| 2007 | $170,486,000 | 40.67% | $195,268,000 | 46.58% | $53,415,000 | 12.74% | $419,169,000 | ||||
| 2008 | $176,821,000 | 39.47% | $216,580,000 | 48.34% | $54,595,000 | 12.19% | $447,996,000 | ||||
| 2009 | $192,543,000 | 39.24% | $235,325,000 | 47.96% | $62,785,000 | 12.80% | $490,653,000 | ||||
| 2010 | $192,493,000 | 40.23% | $213,750,000 | 44.68% | $72,179,000 | 15.09% | $478,422,000 |
| 2011 | $203,328,000 | 41.67% | $206,617,000 | 42.34% | $77,995,000 | 15.98% | $487,940,000 |
| 2012 | $204,444,000 | 40.61% | $227,474,000 | 45.18% | $71,514,000 | 14.21% | $503,432,000 |
| 2013 | $205,283,000 | 43.49% | $206,001,000 | 43.64% | $60,771,000 | 12.87% | $472,055,000 |
| Avg. | $141,053,143 | 39.10% | $171,793,905 | 48.89% | $44,170,952 | 12.01% | $357,018,000 |
Expenditures
The table below separates the district's expenditures into five categories identified by the agency:
- Instruction: operation expenditures, state payments on behalf of the district for instruction and benefits, and retirement system transfers
- Support Services: support services, food services, and retirement system transfers for support service staff
- Capital Spending: capital outlay expenditures (i.e., construction, land or facilities purchases, and equipment purchases)
- Debt & Gov. Payments: payments to state and local governments and interest on school system debt
- Other: all other non-K-12 programs, except food services
| Expenditures by Category | |||||||||||
|---|---|---|---|---|---|---|---|---|---|---|---|
| Fiscal Year |
Instruction | Support Services | Capital Spending | Debt & Gov. Payments | Other | Budget Total | |||||
| Total | % of Budget | Total | % of Budget | Total | % of Budget | Total | % of Budget | Total | % of Budget | ||
| Click [show] on the right to display the expenditure data for prior years. | |||||||||||
|---|---|---|---|---|---|---|---|---|---|---|---|
| 1993 | $119,195,000 | 56.12% | $81,266,000 | 38.26% | $7,873,000 | 3.71% | $3,207,000 | 1.51% | $860,000 | 0.40% | $212,401,000 |
| 1994 | $125,507,000 | 57.27% | $82,471,000 | 37.63% | $8,852,000 | 4.04% | $1,678,000 | 0.77% | $634,000 | 0.29% | $219,142,000 |
| 1995 | $132,081,000 | 57.07% | $85,121,000 | 36.78% | $11,688,000 | 5.05% | $1,807,000 | 0.78% | $735,000 | 0.32% | $231,432,000 |
| 1996 | $135,412,000 | 57.05% | $88,282,000 | 37.19% | $11,205,000 | 4.72% | $1,602,000 | 0.67% | $854,000 | 0.36% | $237,355,000 |
| 1997 | $141,937,000 | 57.15% | $91,368,000 | 36.79% | $12,674,000 | 5.10% | $1,454,000 | 0.59% | $947,000 | 0.38% | $248,380,000 |
| 1998 | $156,757,000 | 57.45% | $99,434,000 | 36.44% | $14,231,000 | 5.22% | $1,291,000 | 0.47% | $1,153,000 | 0.42% | $272,866,000 |
| 1999 | $163,939,000 | 55.54% | $104,829,000 | 35.51% | $23,485,000 | 7.96% | $1,844,000 | 0.62% | $1,096,000 | 0.37% | $295,193,000 |
| 2000 | $170,855,000 | 54.56% | $107,076,000 | 34.19% | $32,180,000 | 10.28% | $2,019,000 | 0.64% | $1,006,000 | 0.32% | $313,136,000 |
| 2001 | $178,553,000 | 55.55% | $113,215,000 | 35.22% | $25,915,000 | 8.06% | $2,720,000 | 0.85% | $1,009,000 | 0.31% | $321,412,000 |
| 2002 | $193,684,000 | 57.27% | $118,467,000 | 35.03% | $21,779,000 | 6.44% | $3,112,000 | 0.92% | $1,175,000 | 0.35% | $338,217,000 |
| 2003 | $198,522,000 | 56.57% | $125,405,000 | 35.74% | $23,012,000 | 6.56% | $2,749,000 | 0.78% | $1,241,000 | 0.35% | $350,929,000 |
| 2004 | $201,038,000 | 56.01% | $128,782,000 | 35.88% | $25,414,000 | 7.08% | $2,432,000 | 0.68% | $1,241,000 | 0.35% | $358,907,000 |
| 2005 | $206,128,000 | 55.65% | $137,394,000 | 37.09% | $22,623,000 | 6.11% | $2,939,000 | 0.79% | $1,318,000 | 0.36% | $370,402,000 |
| 2006 | $211,422,000 | 52.30% | $149,631,000 | 37.01% | $38,577,000 | 9.54% | $3,331,000 | 0.82% | $1,306,000 | 0.32% | $404,267,000 |
| 2007 | $220,648,000 | 51.82% | $159,689,000 | 37.50% | $39,692,000 | 9.32% | $4,381,000 | 1.03% | $1,426,000 | 0.33% | $425,836,000 |
| 2008 | $239,982,000 | 53.90% | $166,453,000 | 37.38% | $32,447,000 | 7.29% | $5,128,000 | 1.15% | $1,251,000 | 0.28% | $445,261,000 |
| 2009 | $254,255,000 | 53.07% | $180,933,000 | 37.76% | $37,187,000 | 7.76% | $5,558,000 | 1.16% | $1,177,000 | 0.25% | $479,110,000 |
| 2010 | $265,778,000 | 53.38% | $188,835,000 | 37.93% | $33,535,000 | 6.74% | $5,347,000 | 1.07% | $4,376,000 | 0.88% | $497,871,000 |
| 2011 | $265,217,000 | 54.00% | $188,192,000 | 38.32% | $29,285,000 | 5.96% | $5,017,000 | 1.02% | $3,393,000 | 0.69% | $491,104,000 |
| 2012 | $281,104,000 | 54.16% | $198,417,000 | 38.23% | $33,451,000 | 6.45% | $4,923,000 | 0.95% | $1,112,000 | 0.21% | $519,007,000 |
| 2013 | $252,386,000 | 53.25% | $187,754,000 | 39.61% | $28,544,000 | 6.02% | $4,365,000 | 0.92% | $901,000 | 0.19% | $473,950,000 |
| Avg. | $195,923,810 | 55.20% | $132,524,476 | 36.93% | $24,459,476 | 6.64% | $3,185,905 | 0.87% | $1,343,381 | 0.37% | $357,437,048 |
Debt
The table below shows the amount of debt retired, issued, and outstanding in the district for each year.
| Debt | |||
|---|---|---|---|
| Fiscal Year |
Retired | Issued | Outstanding |
| Click [show] on the right to display the debt data for prior years. | |||
|---|---|---|---|
| 1993 | $1,480,000 | $0 | $33,035,000 |
| 1994 | $1,980,000 | $0 | $31,055,000 |
| 1995 | $2,154,000 | $0 | $28,901,000 |
| 1996 | $2,340,000 | $0 | $26,561,000 |
| 1997 | $2,525,000 | $0 | $24,036,000 |
| 1998 | $2,705,000 | $0 | $21,331,000 |
| 1999 | $3,445,000 | $20,000,000 | $37,886,000 |
| 2000 | $3,635,000 | $20,000,000 | $54,251,000 |
| 2001 | $4,170,000 | $8,000,000 | $58,081,000 |
| 2002 | $4,829,000 | $3,500,000 | $56,752,000 |
| 2003 | $5,660,000 | $1,400,000 | $52,492,000 |
| 2004 | $6,335,000 | $6,140,000 | $52,297,000 |
| 2005 | $7,120,000 | $33,860,000 | $79,037,000 |
| 2006 | $3,240,000 | $20,000,000 | $95,797,000 |
| 2007 | $3,645,000 | $20,000,000 | $112,152,000 |
| 2008 | $4,250,000 | $15,781,000 | $123,683,000 |
| 2009 | $5,023,000 | $17,359,000 | $136,019,000 |
| 2010 | $6,725,000 | $0 | $129,294,000 |
| 2011 | $6,998,000 | $0 | $122,296,000 |
| 2012 | $8,576,000 | $20,707,000 | $134,427,000 |
| 2013 | $8,965,000 | $0 | $125,462,000 |
| Avg. | $4,561,905 | $8,892,714 | $73,087,857 |
Teacher salaries
The following salary information was pulled from the district's teacher salary schedule. A salary schedule is a list of expected compensations based on variables such as position, years employed, and education level. It may not reflect actual teacher salaries in the district.
| Year | Minimum | Maximum |
|---|---|---|
| 2020[6] | $45,565 | $65,863 |
Academic performance
Proficiency assessments
Each year, state and local education agencies use tests and other standards to assess student proficiency. Although the data below was published by the U.S. Department of Education, proficiency measurements are established by the states. As a result, proficiency levels are not comparable between different states and year-over-year proficiency levels within a district may not be comparable because states may change their proficiency measurements.[7]
Mathematics
The following table shows the percentage of district students who scored at or above the proficiency level each school year:[8]
| School year | All (%) | Asian/Pacific Islander (%) |
Black (%) | Hispanic (%) | Native American (%) |
Two or More Races (%) |
White (%) |
|---|---|---|---|---|---|---|---|
| 2018-2019 | 54 | 85-89 | 43 | 61 | 60-79 | 67 | 74 |
| 2017-2018 | 53 | 90-94 | 42 | 58 | 50-59 | 68 | 74 |
| 2016-2017 | 52 | 85-89 | 43 | 58 | 40-59 | 65 | 71 |
| 2015-2016 | 54 | 85-89 | 44 | 58 | 70-79 | 71 | 73 |
| 2014-2015 | 50 | 85-89 | 39 | 53 | 60-79 | 65-69 | 69 |
| 2013-2014 | 59 | 85-89 | 48 | 65 | 60-69 | 70-74 | 78 |
| 2012-2013 | 58 | 85-89 | 47 | 64 | 60-69 | 70-74 | 77 |
| 2011-2012 | 62 | 85-89 | 50 | 66 | 70-79 | 75-79 | 82 |
| 2010-2011 | 57 | 85-89 | 45 | 66 | 70-79 | 70-74 | 78 |
Reading/language arts
The following table shows the percentage of district students who scored at or above the proficiency level each school year:[8]
| School year | All (%) | Asian/Pacific Islander (%) |
Black (%) | Hispanic (%) | Native American (%) |
Two or More Races (%) |
White (%) |
|---|---|---|---|---|---|---|---|
| 2018-2019 | 62 | 90-94 | 53 | 64 | 60-79 | 73 | 81 |
| 2017-2018 | 62 | 90-94 | 52 | 63 | 70-79 | 75 | 81 |
| 2016-2017 | 62 | 85-89 | 52 | 60 | 70-79 | 74 | 81 |
| 2015-2016 | 63 | 90-94 | 54 | 67 | ≥80 | 80 | 81 |
| 2014-2015 | 62 | 85-89 | 53 | 62 | 60-79 | 75-79 | 81 |
| 2013-2014 | 62 | 85-89 | 52 | 67 | 60-69 | 75-79 | 81 |
| 2012-2013 | 67 | 90-94 | 58 | 70 | 60-69 | 85-89 | 85 |
| 2011-2012 | 65 | 90-94 | 56 | 67 | 70-79 | 75-79 | 83 |
| 2010-2011 | 61 | 80-84 | 51 | 62 | 70-79 | 75-79 | 79 |
Graduation rates
The following table shows the graduation rate of district students each school year:[8][9]
| School year | All (%) | Asian/Pacific Islander (%) |
Black (%) | Hispanic (%) | Native American (%) |
Two or More Races (%) |
White (%) |
|---|---|---|---|---|---|---|---|
| 2017-2018 | 81 | ≥90 | 79 | 75-79 | PS | ≥80 | 84 |
| 2016-2017 | 74 | ≥90 | 70 | 75-79 | ≥50 | 80-89 | 80 |
| 2015-2016 | 74 | 80-89 | 70 | 70-79 | PS | ≥80 | 79 |
| 2014-2015 | 75 | ≥90 | 70 | 80-89 | PS | ≥90 | 81 |
| 2013-2014 | 68 | ≥90 | 62 | 60-69 | ≥50 | 40-49 | 79 |
| 2012-2013 | 64 | 70-79 | 58 | 70-79 | PS | 30-39 | 76 |
| 2011-2012 | 63 | ≥80 | 56 | 70-79 | ≥50 | 60-79 | 75 |
| 2010-2011 | 61 | 80-89 | 55 | 70-79 | PS | ≥50 | 72 |
Student enrollment
| Year[10] | Enrollment | Year-to-year change (%) |
|---|---|---|
| 2018-2019 | 38,199 | -2.9 |
| 2017-2018 | 39,326 | -1.5 |
| 2016-2017 | 39,921 | -1.1 |
| 2015-2016 | 40,356 | -1.1 |
| 2014-2015 | 40,804 | 5.4 |
| 2013-2014 | 38,709 | -3.7 |
| 2012-2013 | 40,209 | -3.5 |
| 2011-2012 | 41,667 | -0.5 |
| 2010-2011 | 41,894 | 0.3 |
| 2009-2010 | 41,757 | -2.0 |
| 2008-2009 | 42,610 | -0.6 |
| 2007-2008 | 42,865 | -0.4 |
| 2006-2007 | 43,019 | -2.1 |
| 2005-2006 | 43,935 | 0.9 |
| 2004-2005 | 43,524 | -2.1 |
| 2003-2004 | 44,473 | -0.2 |
| 2002-2003 | 44,556 | -0.7 |
| 2001-2002 | 44,859 | -0.6 |
| 2000-2001 | 45,119 | -2.4 |
| 1999-2000 | 46,222 | -1.8 |
| 1998-1999 | 47,089 | -2.6 |
| 1997-1998 | 48,347 | -2.3 |
| 1996-1997 | 49,503 | -0.2 |
| 1995-1996 | 49,578 | -0.1 |
| 1994-1995 | 49,603 | -3.2 |
| 1993-1994 | 51,255 | -1.1 |
| 1992-1993 | 51,801 | 0.4 |
| 1991-1992 | 51,592 | 0.4 |
| 1990-1991 | 51,375 | -1.8 |
| 1989-1990 | 52,309 | -0.3 |
| 1988-1989 | 52,470 | 0.0 |
| 1987-1988 | 52,470 | -0.1 |
| 1986-1987 | 52,497 | - |
About the district
Caddo Parish Public Schools is located in Caddo Parish, Louisiana. It is classified as a mid-sized city school district by the National Center for Education Statistics. The district served 38,199 students during the 2018-2019 school year and comprised 64 schools.[11]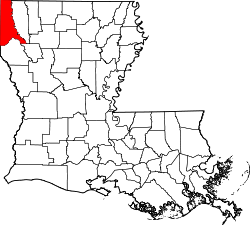
During the 2018-2019 school year, 52.2% of the district's students were eligible for free or reduced-price lunch, 1.4% were English language learners, and 10.6% of students had an Individual Education Plan (IEP).[12]
| Racial Demographics, 2018-2019 | ||
|---|---|---|
| Race | Caddo Parish Public Schools (%) | Louisiana K-12 students (%) |
| American Indian/Alaska Native | N/A | 0.6 |
| Asian or Asian/Pacific Islander | N/A | 1.6 |
| Black | 63.4 | 43.3 |
| Hispanic | 3.8 | 7.4 |
| Native Hawaiian/Pacific Islander | N/A | 0.1 |
| Two or More Races | 2.3 | 2.7 |
| White | 29.1 | 44.4 |
Note: Percentages for race and ethnicity may add up to more than 100 percent because respondents may report more than one race and the Hispanic/Latino ethnicity may be selected in conjunction with any race. Read more about race and ethnicity in the census here.
Noteworthy events
2012: Board term limits
On November 6, 2012, Caddo Parish voters elected by more than 67 percent to instate term limits. Terms won in the 2014 election were the first to be affected by the change. Starting with terms that began on or after January 1, 2015, any member who, at the end of their term, had served more than two and one-half terms in the last three consecutive terms could not be re-elected in the following term. However, they could be re-elected following the one-term break. The limit did not apply retroactively to incumbents, thus allowing them to potentially serve up to 12 more years.[13][2]
| Parishwide School District Local Option Term Limits Proposition (2012) | ||||
|---|---|---|---|---|
| Result | Votes | Percentage | ||
| 72,982 | 79.03% | |||
| No | 19,362 | 20.97% | ||
Ballot text:
| “ | LOCAL OPTION ELECTION
Within Caddo Parish School District: Shall the number of terms of office that any member of the school board may serve be limited to three consecutive four-year terms?[3] |
” |
| —Louisiana Secretary of State's website (2014)[14] | ||
Contact information
Caddo Parish Public Schools
1961 Midway Ave.
Shreveport, LA 71108
Phone: 318-603-6300
See also
| Louisiana | School Board Elections | News and Analysis |
|---|---|---|
 |
 | |
External links
- Search Google News for this topic
- Caddo Parish Public Schools
- Louisiana Department of Education
- Louisiana School Boards Association (LSBA)
Footnotes
- ↑ Caddo Parish Public Schools, "Superintendent," accessed March 26, 2021
- ↑ 2.0 2.1 Louisiana Secretary of State, "QUALIFICATIONS OF CANDIDATES," accessed March 26, 2021
- ↑ 3.0 3.1 Note: This text is quoted verbatim from the original source. Any inconsistencies are attributable to the original source.
- ↑ Caddo Parish Public Schools, "Caddo Parish School Board: Role of the school board," accessed March 26, 2021
- ↑ United States Census Bureau, "Public School System Finances: Historical Data," accessed December 1, 2015
- ↑ Caddo Parish Public Schools, "Caddo Parish School Teacher Salary Schedule," accessed March 26, 2021
- ↑ U.S. Department of Education, Washington, DC: EDFacts, "State Assessments in Reading/Language Arts and Mathematics- School Year 2018-19 EDFacts Data Documentation," accessed February 25, 2021
- ↑ 8.0 8.1 8.2 To protect student privacy, percentages were reported as ranges for groups of 300 students or fewer. If five (5) or fewer students were included in a data set, the data was replaced by "PS."
- ↑ U.S. Department of Education, Washington, DC: EDFacts, "Four-Year Adjusted-Cohort Graduation Rates - School Year 2017-18 EDFacts Data Documentation," accessed February 25, 2021
- ↑ National Center for Education Statistics, "ElSi tableGenerator," accessed March 8, 2021
- ↑ National Center for Education Statistics, "Search for Public School Districts," accessed March 8, 2021
- ↑ National Center for Education Statistics, "Public Elementary/Secondary School Universe Survey," accessed March 8, 2021
- ↑ Louisiana Secretary of State, "HOW ARE CANDIDATES ELECTED?" accessed September 2, 2014
- ↑ Louisiana Secretary of State, "Official Election Results," accessed March 25, 2021
| |||||
