Ballotpedia:Who Runs the States, Partisanship Results, Partisan Control of State Houses
Praise or blame is extended to political parties for the economic, educational, health and other quality of life outcomes that result from the policies those parties enact into law. To better understand which political party enjoys power in each of the states, Ballotpedia has analyzed state government control from 1992-2013 using the concept of a "partisan trifecta." A partisan trifecta is defined as when a state's governorship and legislative chambers are controlled by the same political party.
The two major political parties claim that their policies will lead to better outcomes. What does the data show?
At Ballotpedia, we explored these issues in a three-part study, Who Runs the States.
This page contains the section of the report pertaining to the Partisan Control of State Houses of Representatives.
Partisan Control of State Houses of Representatives
Over the 22-year period of the study, Democrats also held a greater share of the state houses of representatives than Republicans. Overall, Democrats controlled state houses for 53.5 percent of the time, while Republicans held the lower chambers 44.8 percent of the time. State houses were controlled by Democrats, on average, for 11.8 years and by Republicans for 9.9 years. The Democrats had majorities in 26 state houses for more years than the Republicans did, and the Republicans had majorities more often in 21 states. Among these, Democrats and Republicans controlled 18 and 9 state houses, respectively, for more than 80 percent of the time. The Missouri and Texas Houses of Representatives were controlled by each party for 11 consecutive years, with the Democrats in the majority through 2002 and the Republicans taking over in 2003. Nebraska does not have a house of representatives.
Although the Democratic Party exercised greater control than the GOP over American state houses from 1992 through 2013, Republicans have gained ground in recent years. During the first 11 years of this period, Democrats were in the majority 302 of a possible 539 times (56 percent), with each year for each of the 49 state houses counting as one time. Republicans held state house majorities 225 times (41.7 percent). However, in the second half of the study (2003-2013), the GOP narrowed the gap, holding state houses 258 times (47.9 percent). The Democratic Party saw its share fall to 275 times, down to 51 percent. The Democrats controlled the most state houses (37) in 1992 and the fewest (17) in 2012. Conversely, the Republicans controlled the fewest state houses (12) in 1992 and the most (31) in 2012.
As with state senates, most state houses of representatives were predominantly under single-party control. In 18 states, the Democratic Party controlled the state house for more than 80 percent of the study period. The GOP was the majority party for more than 80 percent of the time in 9 states. From 1992 to 2002, the Democrats and Republicans controlled 22 and 14 state houses, respectively, for more than 80 percent of the time. During the past 11 years, the Democrats and Republicans controlled 18 and 17 state houses, respectively, for more than 80 percent of the time. Over the past 11 years, 35 state houses had one party in power more than 80 percent of the time, one state fewer than during the first 11 years.
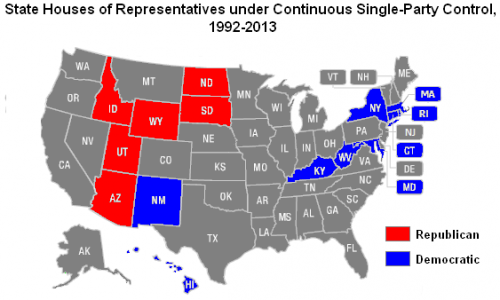
Fewer state houses than state senates were under single-party control for all 22 years. The Democrats controlled nine state houses. Six state houses were exclusively under Republican control. The Democrats were the majority in the Nevada Assembly for the entire time except for 1995 and 1996 when the chamber was tied. The remaining 33 partisan state houses were under each major party’s control for at least one year.
See also
- Ballotpedia:Who runs the states
- Ballotpedia:Who Runs the States, Part One: State Partisanship
- Full report PDF
- State government trifectas


