Federal land policy in Arizona
![]() This article does not contain the most recently published data on this subject. If you would like to help our coverage grow, consider donating to Ballotpedia.
This article does not contain the most recently published data on this subject. If you would like to help our coverage grow, consider donating to Ballotpedia.
| Public Policy |
|---|
 |
| State environmental policy |
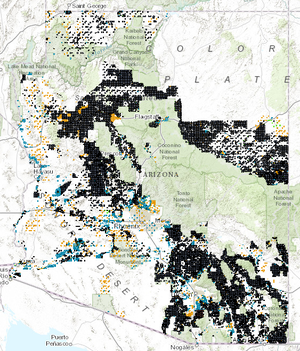
Federal land policy involves the ownership and management of land owned by the federal government. As of 2012, the federal government owned between 635 million to 640 million acres, or 28 percent, of the 2.27 billion acres of land in the United States. Federal land is managed for many purposes, such as the conservation and development of natural resources, grazing and recreation. As of 2012, the federal government owned 42.29 percent of Arizona's total land, 30,741,287 acres out of 72,688,000 total acres.
Land ownership
- See also: Federal land policy and Federal land ownership by state
The federal government owns between 635 million and 640 million acres of land (about 28 percent) of the 2.27 billion acres of land in the United States. Around 52 percent of federally owned acres were in 12 Western states—including Alaska, 61 percent of which was federally owned. In contrast, the federal government owned 4 percent of land in the other 38 states. Federal land policy is designed to manage minerals, oil and gas resources, timber, wildlife and fish, and other natural resources found on federal land. Land management policies are highly debated for their economic, environmental and social impacts. Additionally, the size of the federal estate and the acquisition of more federal land are major issues.[1][2]
Arizona is located in the Western United States. Western states typically contain large amounts of land owned by the federal government. According to the Congressional Research Service, the state of Arizona has a total acreage of 72.69 million acres. Of that total, 42.29 percent, or 30.74 million acres, belongs to the federal government. From 1990 to 2010, the federal government decreased its ownership of land in Arizona by 3.66 million acres. The federal government owns between 635 million to 640 million acres nationwide, or 28 percent of the estimated 2.27 billion acres in the nation. 41.95 million acres in Arizona are not owned by the federal government, which works out to an average of 6.33 acres per capita for the state's 6.627 million residents.[1]
The following table lists federal land ownership in Arizona, and its neighbor, New Mexico. The chart also lists federal land ownership data for Connecticut, as a comparison.
| Federal land ownership in Arizona and other states by agency | |||||||||||
|---|---|---|---|---|---|---|---|---|---|---|---|
| State | |||||||||||
| Agency | Arizona | New Mexico | Connecticut | ||||||||
| Acres owned | Percentage owned | Acres owned | Percentage owned | Acres owned | Percentage owned | ||||||
| U.S. Forest Service | 11,264,619 | 36.64% | 9,417,975 | 34.88% | 24 | 0.28% | |||||
| U.S. National Park Service | 2,618,735 | 8.52% | 376,849 | 1.40% | 5,719 | 66.83% | |||||
| U.S. Fish and Wildlife Service | 1,683,269 | 5.48% | 327,264 | 1.21% | 1,206 | 14.09% | |||||
| U.S. Bureau of Land Management | 12,203,495 | 39.70% | 13,484,405 | 49.94% | 0 | 0.00% | |||||
| U.S. Department of Defense | 2,971,169 | 9.67% | 3,395,090 | 12.57% | 1,608 | 18.79% | |||||
| Total federal land | 30,741,287 | 100% | 27,001,583 | 100% | 8,557 | 100% | |||||
| Source: Congressional Research Service, "Federal Land Ownership: Overview and Data" | |||||||||||
Land usage
Recreation
National parks in Arizona
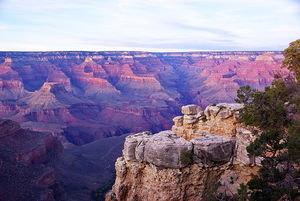
Arizona is home to some of the most famous public lands in the nation, such as the Grand Canyon, Glen Canyon, Lake Mead, Tonto, and Montezuma Castle.[3] In total, Arizona has 22 National Park Service units, one national heritage area, nine national landmarks, 44 national historic landmarks, one world heritage site, nine national monuments, one national forest, four wilderness areas and 10 national historic parks.[4][5] Arizona also has 27 state parks managed by the Arizona State Parks Department.[6] A study by the U.S. National Park Service found that 10.1 million visitors attended Arizona's national parks and monuments and generated $773.9 million in visitor spending in 2013.[7]
State recreation lands
The table below contains a list of all state parks in Arizona.[5]
| State parks in Arizona | ||||||
|---|---|---|---|---|---|---|
| State park name | ||||||
| Almo Lake State Park | ||||||
| Boyce Thompson Arboretum State Park | ||||||
| Buckskin Mountain State Park | ||||||
| Catalina State Park | ||||||
| Cattail Cove State Park | ||||||
| Dead Horse Ranch State Park | ||||||
| Fool Hollow Lake State Park | ||||||
| Fort Verde State Historic Park | ||||||
| Homolovi State Park | ||||||
| Jerome State Historic Park | ||||||
| Kartchner Caverns State Park | ||||||
| Lake Havasu State Park | ||||||
| Lost Dutchman State Park | ||||||
| Lyman Lake State Park | ||||||
| McFarland State Historic Park | ||||||
| Oracle State Park | ||||||
| Patagonia Lake State Park | ||||||
| Picacho Peak State Park | ||||||
| Red Rock State Park | ||||||
| Riordan Mansion State Historic Park | ||||||
| Roper Lake State Park | ||||||
| Slide Rock State Park | ||||||
| Tombstone Courthouse State Historic Park | ||||||
| Tonto Natural Bridge State Park | ||||||
| Tubac Presidio State Historic Park | ||||||
| Yuma Quartermaster Depot State Historic Park | ||||||
| Yuma Territorial Prison State Historic Park | ||||||
Economic impact of state lands
A 2009 study from Northern Arizona University analyzed the economic impact of Arizona's 27 state parks. The study used a type of economic modeling, known as IMPLAN (see box to the right), to estimate the economic impacts of Arizona's state parks on the 13 counties in which the parks are located. The study found the following:[8]
- The total economic impact of state parks in Arizona was $266.4 million in fiscal year 2007 (figure includes direct, indirect and induced impacts).[9]
- Direct spending was $162.79 million in fiscal year 2007.
- Per person spending was $70.84 from 2006 to 2007.
Economic activity on federal lands
Oil and gas activity
- See also: BLM oil and gas leases by state
Private mining companies, including oil and natural gas companies, can apply for leases from the U.S. Bureau of Land Management (BLM) to explore and produce energy on federal land. The company seeking a lease must nominate the land for oil and gas exploration to the BLM, which evaluates and approves the lease. The BLM state offices make leasing decisions based on their land use plans, which contain information on the land's resources and the potential environmental impact of oil or gas exploration. If federal lands are approved for leasing, the BLM requires an application from the company containing information on how the exploration, drilling and production will be conducted. Afterward, the BLM will produce an environmental analysis and a list of requirements before work on the land can begin. The agency also inspects the companies' drilling and producing on the leased lands.[10]
In 2013, there were 47,427 active leases covering 36.09 million acres of federal land nationwide. Of that total, 27 leases (0.06 percent of all leases), covering 0.39 million acres (0.11 percent of all leased land in 2013), were in Arizona. In 2013, out of 3,770 new drilling leases approved nationwide by the BLM for oil and gas exploration, no leases were in Arizona.[11][12][13][14][15]
The table below shows how Arizona compared to neighboring states in oil and gas permits on BLM-managed lands in 2013.
| Oil and gas leasing on BLM lands by state | ||||
|---|---|---|---|---|
| State | Active permits on BLM lands (FY 2013) | Total acres under lease (FY 2013) | State percentage of total permits | State percentage of total acres |
| Arizona | 27 | 39,562 | 0.06% | 0.11% |
| Utah | 3,574 | 3,821,792 | 7.54% | 10.59% |
| Nevada | 1,881 | 3,732,390 | 3.97% | 10.34% |
| Colorado | 4,963 | 3,915,506 | 10.46% | 10.85% |
| New Mexico | 8,348 | 4,819,205 | 17.60% | 13.35% |
| Total United States | 47,427 permits | 36,092,482 acres | - | - |
| Source: U.S. Bureau of Land Management, "Oil and Gas Statistics" | ||||
Grazing permits
- See also: Grazing permits on federal land
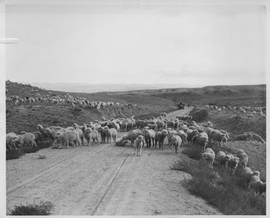
The U.S. Bureau of Land Management (BLM) manages livestock grazing on 155 million acres of its public lands. Nationally, the BLM oversees about 18,000 permits and leases that allow ranchers to graze their livestock, mostly sheep and cows, on BLM-managed lands. The permits and leases overseen by the BLM are valid for 10-years and the fees are based on the number of animals the rancher has on the land. To track these animals the BLM created what are called Animal Unit Months (AUMs), or "the amount of forage needed to sustain one cow, five sheep, or five goats for a month." Since 1954, grazing on public lands has declined, from 18.2 million AUMs to 7.9 million AUMs in 2013. Holding a grazing permit requires the applicant to own or control the property used for grazing. The applicant may also offer other privately owned property used for grazing by submitting a separate application. The terms and conditions in a grazing permit control how livestock must be used on BLM lands.[16][17][18]
The table compares the grazing permits in the 10 states in the nation where permits are issued.[19][20][21][22][23][24][25]
| Grazing on BLM lands (March 2011) | ||||||
|---|---|---|---|---|---|---|
| State | BLM land (acres) | Grazing allotments | Grazing permits | Animal unit months (AUMs) of livestock use | ||
| Arizona | 12,203,495 | 824 | 759 | 659,990 | ||
| Alaska | 72,958,757 | 15 | N/A | N/A | ||
| California | 15,306,243 | 699 | 572 | 525,000 | ||
| Colorado | 8,332,001 | 2,500 | 1,500 | N/A | ||
| Idaho | 11,610,111 | N/A | 199 | 832,000 | ||
| Nevada | 47,805,923 | 745 | 635 | 1,100,000 | ||
| Oregon | 16,134,191 | N/A | 753 | 960,288 | ||
| South Dakota | 274,437 | 504 | N/A | 73,800 | ||
| Utah | 22,854,937 | 1,410 | 1,462 | 1,300,000 | ||
| Washington | 429,156 | N/A | 266 (leases) | 32,976 | ||
Payments in lieu of taxes
- See also: Payments in lieu of taxes
Since local governments cannot collect taxes on federally owned property, the U.S. Department of the Interior issues payments to local governments to replace lost property tax revenue from federal land. The payments, known as "Payments in Lieu of Taxes" (PILTs), are typically used for funding services such as fire departments, police protection, school construction and roads.[26]
The table below shows PILTs for Arizona compared to neighboring states between 2011 and 2013.
| Total PILTs for Arizona and neighboring states | ||||||
|---|---|---|---|---|---|---|
| State | FY 2011 | FY 2012 | FY 2013 | State's percentage of 2013 total | ||
| Arizona | $31,546,890 | $32,886,575 | $32,203,852 | 8.02% | ||
| Utah | $34,659,277 | $36,038,626 | $35,391,052 | 8.81% | ||
| Nevada | $22,942,298 | $23,917,845 | $23,331,913 | 5.81% | ||
| Colorado | $27,022,334 | $27,724,576 | $31,986,266 | 7.96% | ||
| New Mexico | $32,916,396 | $34,805,383 | $34,692,967 | 8.64% | ||
| Source: U.S. Department of the Interior, "PILT" | ||||||
State trust lands
The Arizona State Land Department manages 9.23 million acres of state land intended to benefit specific educational and medical institutions. Almost all of the state's trust lands have one or more leases for natural resource or commercial development purposes. Most of Arizona's state trust lands are used for grazing, although some have the potential for agricultural development. The department's urban lands lease and sale program has become the largest revenue generator, as the growth of cities like Phoenix and Tucson have increased the demand for land. Approximately 90 percent of the revenues generated from the trust go to the common school trust. The department has disposed of, or exchanged, about 1.628 million acres of trust land in the 88 years it has existed.[27]
The table below lists the 14 beneficiaries of state trust lands and the acreage apportioned to each beneficiary as of fiscal year 2008.[27]
| Arizona state land beneficiaries and land acreage | |
|---|---|
| Beneficiary | Fiscal year 2008 acres |
| Common Schools (K-12) | 8,098,658 |
| Legislative, Executive & Judicial Buildings | 64,257 |
| State Hospital Grant | 71,248 |
| Miners’ Hospital* | 95,429 |
| State Charitable, Penal & Reformatory Institutions | 76,818 |
| Penitentiary Grant | 76,111 |
| Normal Schools Grant | 174,798 |
| Agricultural & Mechanical Colleges | 124,944 |
| Military Institutes Grant | 80,168 |
| School of Mines Grant | 123,254 |
| University Land Code | 137,907 |
| University of Arizona | 54,101 |
| School for the Deaf & Blind | 82,560 |
| Total | 9,260,253 |
| *Miners' Hospital and Miners' 1929 combined Source: Arizona State Land Department | |
Environmental policy in the 50 states
Click on a state below to read more about that state's energy policy.
See also
External links
Footnotes
- ↑ 1.0 1.1 Congressional Research Service, "Federal Land Ownership: Overview and Data," accessed September 15, 2014
- ↑ U.S. Congressional Research Service, "Federal Lands and Natural Resources: Overview and Selected Issues for the 113th Congress," December 8, 2014
- ↑ National Park Service, "Arizona," accessed November 18, 2014
- ↑ National Park Service, "Working with Arizona," accessed November 18, 2014
- ↑ 5.0 5.1 Visit Arizona, "Arizona Parks & Monuments," accessed November 18, 2014
- ↑ Visit Arizona, "Arizona State Parks," accessed November 18, 2014
- ↑ U.S. National Park Service, "2013 National Park Visitor Spending Effects Report," accessed October 14, 2014
- ↑ Arizona State Parks, "Publications," accessed November 18, 2014
- ↑ Economists use forecasting models, such as IMPLAN and REMI, to predict the impact of certain economic activities on the economy. These studies usually measure both direct impacts, i.e., the jobs and income being added within the oil and gas industry, and indirect impacts, i.e., jobs created throughout the supply chain. These studies also include induced impact, i.e., jobs created through increased spending due to growth in the industry.
- ↑ U.S. Bureau of Land Management, "Oil and Gas Lease Sales," accessed October 20, 2014
- ↑ U.S. Bureau of Land Management, "Number of Acres Leased During the Fiscal Year," accessed October 20, 2014
- ↑ U.S. Bureau of Land Management, "Total Number of Leases in Effect," accessed October 20, 2014
- ↑ U.S. Bureau of Land Management, "Summary of Onshore Oil and Gas Statistics," accessed October 20, 2014
- ↑ U.S. Bureau of Land Management, "Number of Drilling Permits Approved by Fiscal Year on Federal Lands," accessed October 20, 2014
- ↑ U.S. Bureau of Land Management, "Total Number of Acres Under Lease As of the Last Day of the Fiscal Year," accessed October 22, 2014
- ↑ U.S. Bureau of Land Management, "Grazing Permits," accessed October 6, 2014
- ↑ U.S. Bureau of Land Management, "Rangeland Program Glossary," March 4, 2011
- ↑ U.S. Bureau of Land Management, "Fact Sheet on the BLM’s Management of Livestock Grazing," March 28, 2014
- ↑ U.S. Bureau of Land Management, "Grazing and Rangeland Management," December 14, 2012
- ↑ U.S. Bureau of Land Management, "Grazing and Rangeland Management," December 14, 2012
- ↑ U.S. Bureau of Land Management, "Grazing and Rangeland Management," December 14, 2012
- ↑ U.S. Bureau of Land Management, "Grazing and Rangeland Management," December 14, 2012
- ↑ U.S. Bureau of Land Management, "Grazing and Rangeland Management," December 14, 2012
- ↑ U.S. Bureau of Land Management, "Grazing and Rangeland Management," December 14, 2012
- ↑ U.S. Bureau of Land Management, "Grazing and Rangeland Management," December 14, 2012
- ↑ U.S. Department of the Interior, "PILT," accessed October 4, 2014
- ↑ 27.0 27.1 Cite error: Invalid
<ref>tag; no text was provided for refs namedASLD history


