Racine Unified School District elections (2018)
- General election: Nov. 6
- Voter registration deadline: Oct. 17 (online or mail), or Nov. 2 (in-person)
- Early voting: Varies by locality
- Absentee voting deadline: Nov. 6
- Online registration: Yes
- Same-day registration: Yes
- Voter ID: Photo ID required
- Poll times: 7:00 a.m. to 8:00 p.m.
2019 →
← 2017 |
|---|
|
|
| Enrollment ('15-'16) |
|
|
Three of the nine seats on the Racine Unified School District Board of Education in Wisconsin were up for by-district general election on April 3, 2018. District 5 incumbent Steven Hooper did not file for re-election, leaving the seat open. Jane Barbian was the only candidate to file for the District 5 seat and ran unopposed. District 4 incumbent Julie McKenna and District 6 incumbent John Heckenlively filed for re-election and were unopposed in their bids for re-election.[1]
Elections
Voter and candidate information
The Racine Unified School District school board consists of nine members elected to three-year terms on a staggered basis. All members are elected by district, and elections are held every year. The board was elected at large until the 2016 election, when all nine seats were on the ballot following state legislation passed in July 2015 impacting the district's board representation.
School board candidates in Wisconsin had to be U.S. citizens, at least 18 years old, and residents of the school district for a minimum of 28 consecutive days before filing as a candidate. They also could not be disqualified from voting under Wisconsin law.[2]
To get on the ballot, school board candidates had to file nomination papers with the school district clerk by January 2, 2018. If incumbents whose terms were up for re-election did not file to run in the race and did not file written notification that they would not be running, the candidate filing deadline could have been extended until January 5, 2018. The terms of candidates elected in the race started on April 23, 2018.[2]
Voter registration
- See also: Voting in Wisconsin and Voter identification laws by state
To vote in Wisconsin, one must be a citizen of the United States and a resident of the state for at least 10 days prior to the election. A voter must be at least 18 years old.[3][4][5] One can register to vote by mail, online, or in person. For voters registering to vote in this 2018 school board election by mail, the application had to be postmarked by March 14, 2018. The online voter registration deadline was March 30, 2018, and the in-person deadline was April 3, 2018.
Candidates and results
District 4
General election
General election for Racine Unified School District Board of Education District 4
Candidate | % | Votes | ||
| ✔ |  | Julie McKenna (Nonpartisan) | 99.6 | 1,515 |
| Other/Write-in votes | 0.4 | 6 | ||
| Total votes: 1,521 | |||
| If you are a candidate and would like to tell readers and voters more about why they should vote for you, complete the Ballotpedia Candidate Connection Survey. | ||||
District 5
General election
General election for Racine Unified School District Board of Education District 5
Candidate | % | Votes | ||
| ✔ |  | Jane Barbian (Nonpartisan) | 99.1 | 2,224 |
| Other/Write-in votes | 0.9 | 21 | ||
| Total votes: 2,245 | |||
| If you are a candidate and would like to tell readers and voters more about why they should vote for you, complete the Ballotpedia Candidate Connection Survey. | ||||
District 6
General election
General election for Racine Unified School District Board of Education District 6
Candidate | % | Votes | ||
| ✔ |  | John Heckenlively (Nonpartisan) | 96.3 | 500 |
| Other/Write-in votes | 3.7 | 19 | ||
| Total votes: 519 | |||
| If you are a candidate and would like to tell readers and voters more about why they should vote for you, complete the Ballotpedia Candidate Connection Survey. | ||||
Additional elections on the ballot
- See also: Wisconsin elections, 2018
Key deadlines
Endorsements
Do you know of an official or organization that endorsed a candidate in this race? Let Ballotpedia know by email at editor@ballotpedia.org.
Past elections
To see results from past elections in the Racine Unified School District, click here.
What was at stake?
Report a story for this election
Ballotpedia researches issues in school board elections across the United States, but information availability is a challenge for us in many school districts. Please contact us about the issues that impact your local school district. Note that not all submissions may meet Ballotpedia's coverage requirements for inclusion.
Candidate survey
|
|
Ballotpedia invites school board candidates to participate in its annual survey. |
Election trends
- See also: School board elections, 2018

In 2018 and 2017, two of the three Racine Board of Education incumbents with seats up for re-election filed to retain their seats. From 2014 to 2016, all incumbents filed for re-election. In 2016, 78.38 percent of Wisconsin incumbents and 71.31 percent of United States school board incumbents filed for re-election.
| School board election trends | |||||
|---|---|---|---|---|---|
| Year | Candidates per seat | Uncontested seats | Incumbents running for re-election | Incumbent success rate | Seats won by newcomers |
| Racine Unified School District | |||||
| 2018 | 1.0 | 100.00% | 66.67% | 100.00% | 33.33% |
| 2017 | 1.0 | 100.00% | 66.67% | 100.00% | 33.33% |
| 2016 | 2.1 | 11.11% | 100.00% | 44.44% | 55.56% |
| 2015 | 1.67 | 0.00% | 100.00% | 66.67% | 33.33% |
| 2014 | 1.75 | 0.00% | 100.00% | 100.00% | 0.00% |
| Wisconsin | |||||
| 2016 | 1.57 | 29.73% | 78.38% | 68.97% | 45.95% |
| 2015 | 1.38 | 32.00% | 73.53% | 84.00% | 35.29% |
| United States | |||||
| 2016 | 1.90 | 34.05% | 71.31% | 82.39% | 41.04% |
| 2015 | 1.72 | 35.95% | 70.37% | 82.66% | 40.81% |
Issues in the district
District improves state rating, no longer faces takeover, partial dismantling
A 2015 Wisconsin state law allows schools within districts that meet certain criteria to leave the school district and enter the Opportunity Schools and Partnership Program (OSPP). To be eligible, school districts must receive intradistrict transfer aid, have more than 15,000 students, and be rated as fails to meet expectations for two years in a row. Schools in the OSPP would be managed by program commissioners who are appointed by the district's county executive. As of the 2017-2018 school year, no districts had schools in the OSPP.[6]
Six schools in Wisconsin had over 15,000 students in the 2015-2016 school year, including Racine Unified School District. As Racine Unified School District also received intradistrict transfer aid and was given a score of 48.1 out of 100, or a fails to meet expectations rating, during the 2015-2016 school year, the district was close to meeting all three criteria. Had the district received another failing grade for the 2016-2017 school year, an advisory referendum could have gone to the ballot for voters to decide whether to split the district and have some schools enter the OSPP. An amendment to the state budget in September 2017 changed the fails to meet expectations requirement from two years to three years to allow Racine Unified School District more time to improve their rating. During the 2016-2017, the district received a rating of meets few expectations, with a score of 59.3 out of 100, meaning it no longer faced dismantling.[6][7][8]
About the district
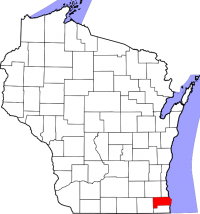
The Racine Unified School District is located in Racine, which is the seat of government for Racine County in southeastern Wisconsin. Racine County was home to 195,080 residents in 2015, according to the United States Census Bureau. The district served 19,184 students during the 2015-2016 school year.[9][10]
Demographics
Higher education achievement
Racine County underperformed compared to Wisconsin as a whole in terms of higher education achievement between 2011 and 2015. The United States Census Bureau found that 23.7 percent of county residents aged 25 years and older had attained a bachelor's degree, compared to 27.8 percent for the state as a whole.[10]
Median household income
From 2011 to 2015, the median household income for Racine County was $55,584. During that same period, the median household income for Wisconsin was $53,357.[11]
Poverty rate
From 2011 to 2015, the poverty rate in Racine County was 12.4 percent. During that same time period, the poverty rate was 12.1 percent for the entire state.[10][11]
| Racial Demographics, 2015[10] | ||
|---|---|---|
| Race | Racine County (%) | Wisconsin (%) |
| White | 83.9 | 87.6 |
| Black or African American | 11.8 | 6.6 |
| American Indian and Alaska Native | 0.6 | 1.1 |
| Asian | 1.3 | 2.8 |
| Native Hawaiian and Other Pacific Islander | 0.1 | 0.1 |
| Two or More Races | 2.3 | 1.8 |
| Hispanic or Latino | 12.7 | 6.6 |
Note: Percentages for race and ethnicity may add up to more than 100 percent because respondents may report more than one race and the Hispanic/Latino ethnicity may be selected in conjunction with any race. Read more about race and ethnicity in the census here.
Pivot Counties
- See also: Pivot Counties by state
Twenty-three of 72 Wisconsin counties—32 percent—are Pivot Counties. Pivot Counties are counties that voted for Barack Obama (D) in 2008 and 2012 and for Donald Trump (R) in 2016. Altogether, the nation had 206 Pivot Counties, with most being concentrated in upper midwestern and northeastern states.
| Counties won by Trump in 2016 and Obama in 2012 and 2008 | |||||||
|---|---|---|---|---|---|---|---|
| County | Trump margin of victory in 2016 | Obama margin of victory in 2012 | Obama margin of victory in 2008 | ||||
| Adams County, Wisconsin | 21.92% | 8.73% | 18.35% | ||||
| Buffalo County, Wisconsin | 21.82% | 2.93% | 14.66% | ||||
| Columbia County, Wisconsin | 2.14% | 13.58% | 15.26% | ||||
| Crawford County, Wisconsin | 5.40% | 19.98% | 27.03% | ||||
| Door County, Wisconsin | 3.22% | 6.99% | 17.33% | ||||
| Dunn County, Wisconsin | 11.09% | 4.97% | 14.95% | ||||
| Forest County, Wisconsin | 26.58% | 5.44% | 15.16% | ||||
| Grant County, Wisconsin | 9.43% | 13.77% | 23.88% | ||||
| Jackson County, Wisconsin | 11.74% | 15.01% | 21.84% | ||||
| Juneau County, Wisconsin | 26.05% | 7.03% | 9.00% | ||||
| Kenosha County, Wisconsin | 0.31% | 12.23% | 18.06% | ||||
| Lafayette County, Wisconsin | 8.99% | 15.37% | 22.32% | ||||
| Lincoln County, Wisconsin | 20.60% | 0.71% | 12.48% | ||||
| Marquette County, Wisconsin | 24.09% | 0.27% | 5.28% | ||||
| Pepin County, Wisconsin | 23.08% | 2.22% | 12.89% | ||||
| Price County, Wisconsin | 25.00% | 0.04% | 13.40% | ||||
| Racine County, Wisconsin | 4.28% | 3.54% | 7.41% | ||||
| Richland County, Wisconsin | 5.50% | 16.13% | 20.63% | ||||
| Sauk County, Wisconsin | 0.35% | 18.47% | 23.04% | ||||
| Sawyer County, Wisconsin | 18.41% | 0.49% | 6.23% | ||||
| Trempealeau County, Wisconsin | 12.64% | 14.08% | 26.39% | ||||
| Vernon County, Wisconsin | 4.43% | 14.73% | 22.00% | ||||
| Winnebago County, Wisconsin | 7.34% | 3.73% | 11.66% | ||||
In the 2016 presidential election, Donald Trump (R) won Wisconsin with 47.2 percent of the vote. Hillary Clinton (D) received 46.5 percent. In presidential elections between 1900 and 2016, Wisconsin cast votes for the winning presidential candidate 76.7 percent of the time. In that same time frame, Wisconsin supported Republicans slightly more than Democratic candidates, 50.0 to 46.7 percent. The state, however, favored Democrats in every presidential election from 2000 to 2012 before voting for Trump in 2016.
Presidential results by legislative district
The following table details results of the 2012 and 2016 presidential elections by state Assembly districts in Wisconsin. Click [show] to expand the table. The "Obama," "Romney," "Clinton," and "Trump" columns describe the percent of the vote each presidential candidate received in the district. The "2012 Margin" and "2016 Margin" columns describe the margin of victory between the two presidential candidates in those years. The "Party Control" column notes which party held that seat heading into the 2018 general election. Data on the results of the 2012 and 2016 presidential elections broken down by state legislative districts was compiled by Daily Kos.[12][13]
| In 2012, Barack Obama (D) won 43 out of 99 state Assembly districts in Wisconsin with an average margin of victory of 34.1 points. In 2016, Hillary Clinton (D) won 36 out of 99 state Assembly districts in Wisconsin with an average margin of victory of 34.6 points. Clinton won three districts controlled by Republicans heading into the 2018 elections. |
| In 2012, Mitt Romney (R) won 56 out of 99 state Assembly districts in Wisconsin with an average margin of victory of 12.1 points. In 2016, Donald Trump (R) won 63 out of 99 state Assembly districts in Wisconsin with an average margin of victory of 19.4 points. Trump won two districts controlled by Democrats heading into the 2018 elections. |
| 2016 Presidential Results by State Assembly District ' | |||||||
|---|---|---|---|---|---|---|---|
| District | Obama | Romney | 2012 Margin | Clinton | Trump | 2016 Margin | Party Control |
| 1 | 49.45% | 49.55% | R+0.1 | 40.19% | 55.31% | R+15.1 | R |
| 2 | 45.06% | 53.88% | R+8.8 | 35.98% | 58.55% | R+22.6 | R |
| 3 | 46.37% | 52.37% | R+6 | 39.25% | 54.77% | R+15.5 | R |
| 4 | 47.96% | 51.02% | R+3.1 | 42.82% | 51.96% | R+9.1 | R |
| 5 | 45.84% | 53.01% | R+7.2 | 35.60% | 58.94% | R+23.3 | R |
| 6 | 44.15% | 54.75% | R+10.6 | 30.90% | 64.34% | R+33.4 | R |
| 7 | 57.11% | 41.73% | D+15.4 | 55.20% | 39.20% | D+16 | D |
| 8 | 86.53% | 12.79% | D+73.7 | 82.43% | 14.14% | D+68.3 | D |
| 9 | 74.69% | 24.42% | D+50.3 | 71.60% | 23.86% | D+47.7 | D |
| 10 | 89.76% | 9.63% | D+80.1 | 89.09% | 8.09% | D+81 | D |
| 11 | 86.92% | 12.62% | D+74.3 | 85.40% | 12.20% | D+73.2 | D |
| 12 | 80.00% | 19.52% | D+60.5 | 79.28% | 17.84% | D+61.4 | D |
| 13 | 41.61% | 57.43% | R+15.8 | 46.60% | 48.01% | R+1.4 | R |
| 14 | 42.53% | 56.71% | R+14.2 | 49.36% | 45.05% | D+4.3 | R |
| 15 | 44.86% | 54.03% | R+9.2 | 43.63% | 50.53% | R+6.9 | R |
| 16 | 90.18% | 8.97% | D+81.2 | 88.16% | 8.20% | D+80 | D |
| 17 | 86.03% | 13.52% | D+72.5 | 85.53% | 11.96% | D+73.6 | D |
| 18 | 89.18% | 10.15% | D+79 | 87.03% | 9.71% | D+77.3 | D |
| 19 | 69.95% | 28.13% | D+41.8 | 72.67% | 20.16% | D+52.5 | D |
| 20 | 58.37% | 40.39% | D+18 | 55.33% | 39.27% | D+16.1 | D |
| 21 | 47.93% | 51.07% | R+3.1 | 44.81% | 50.06% | R+5.3 | R |
| 22 | 42.44% | 56.73% | R+14.3 | 35.41% | 60.15% | R+24.7 | R |
| 23 | 34.62% | 64.61% | R+30 | 50.43% | 44.81% | D+5.6 | R |
| 24 | 43.05% | 56.18% | R+13.1 | 45.71% | 49.32% | R+3.6 | R |
| 25 | 46.93% | 51.76% | R+4.8 | 35.85% | 58.74% | R+22.9 | R |
| 26 | 45.64% | 53.35% | R+7.7 | 38.91% | 55.22% | R+16.3 | R |
| 27 | 45.07% | 53.89% | R+8.8 | 40.39% | 54.00% | R+13.6 | R |
| 28 | 43.68% | 54.77% | R+11.1 | 32.63% | 61.90% | R+29.3 | R |
| 29 | 48.16% | 50.05% | R+1.9 | 38.58% | 54.01% | R+15.4 | R |
| 30 | 46.24% | 52.24% | R+6 | 42.51% | 50.44% | R+7.9 | R |
| 31 | 46.56% | 52.48% | R+5.9 | 40.68% | 53.70% | R+13 | R |
| 32 | 41.42% | 57.37% | R+15.9 | 34.97% | 59.41% | R+24.4 | R |
| 33 | 39.95% | 58.97% | R+19 | 35.54% | 59.27% | R+23.7 | R |
| 34 | 44.59% | 54.39% | R+9.8 | 35.28% | 60.34% | R+25.1 | R |
| 35 | 46.89% | 52.10% | R+5.2 | 34.68% | 60.52% | R+25.8 | R |
| 36 | 46.49% | 52.48% | R+6 | 32.07% | 64.35% | R+32.3 | R |
| 37 | 45.97% | 52.93% | R+7 | 39.87% | 54.26% | R+14.4 | R |
| 38 | 41.66% | 57.48% | R+15.8 | 38.23% | 56.78% | R+18.5 | R |
| 39 | 42.12% | 56.85% | R+14.7 | 32.76% | 62.11% | R+29.4 | R |
| 40 | 45.04% | 53.94% | R+8.9 | 32.61% | 62.85% | R+30.2 | R |
| 41 | 48.58% | 50.35% | R+1.8 | 36.02% | 59.60% | R+23.6 | R |
| 42 | 51.09% | 48.03% | D+3.1 | 40.26% | 54.51% | R+14.3 | R |
| 43 | 58.46% | 40.22% | D+18.2 | 50.24% | 43.54% | D+6.7 | D |
| 44 | 63.57% | 35.53% | D+28 | 55.44% | 38.62% | D+16.8 | D |
| 45 | 63.99% | 34.88% | D+29.1 | 52.83% | 41.86% | D+11 | D |
| 46 | 63.63% | 35.46% | D+28.2 | 61.74% | 32.95% | D+28.8 | D |
| 47 | 71.05% | 27.83% | D+43.2 | 71.89% | 23.13% | D+48.8 | D |
| 48 | 77.21% | 21.61% | D+55.6 | 76.06% | 19.26% | D+56.8 | D |
| 49 | 56.34% | 42.26% | D+14.1 | 42.01% | 51.26% | R+9.3 | R |
| 50 | 54.10% | 44.84% | D+9.3 | 38.35% | 57.05% | R+18.7 | R |
| 51 | 59.12% | 39.77% | D+19.4 | 48.42% | 46.59% | D+1.8 | R |
| 52 | 45.04% | 53.91% | R+8.9 | 38.03% | 56.66% | R+18.6 | R |
| 53 | 43.36% | 55.55% | R+12.2 | 34.18% | 60.93% | R+26.7 | R |
| 54 | 57.39% | 41.08% | D+16.3 | 49.16% | 44.12% | D+5 | D |
| 55 | 47.32% | 51.08% | R+3.8 | 41.80% | 51.70% | R+9.9 | R |
| 56 | 43.05% | 55.69% | R+12.6 | 37.98% | 56.68% | R+18.7 | R |
| 57 | 58.41% | 39.31% | D+19.1 | 51.73% | 41.22% | D+10.5 | D |
| 58 | 31.25% | 67.77% | R+36.5 | 28.43% | 66.52% | R+38.1 | R |
| 59 | 31.24% | 67.73% | R+36.5 | 25.52% | 69.73% | R+44.2 | R |
| 60 | 31.82% | 67.23% | R+35.4 | 32.35% | 62.53% | R+30.2 | R |
| 61 | 44.42% | 54.59% | R+10.2 | 36.49% | 58.50% | R+22 | R |
| 62 | 45.73% | 53.46% | R+7.7 | 41.17% | 54.02% | R+12.9 | R |
| 63 | 42.73% | 56.47% | R+13.7 | 37.80% | 57.26% | R+19.5 | R |
| 64 | 58.84% | 40.05% | D+18.8 | 52.63% | 42.23% | D+10.4 | D |
| 65 | 67.06% | 31.78% | D+35.3 | 57.76% | 36.48% | D+21.3 | D |
| 66 | 75.23% | 23.77% | D+51.5 | 68.34% | 26.50% | D+41.8 | D |
| 67 | 48.07% | 50.75% | R+2.7 | 36.41% | 58.15% | R+21.7 | R |
| 68 | 51.24% | 47.56% | D+3.7 | 40.11% | 54.44% | R+14.3 | R |
| 69 | 43.65% | 55.15% | R+11.5 | 34.08% | 60.83% | R+26.8 | R |
| 70 | 48.55% | 50.09% | R+1.5 | 36.82% | 57.83% | R+21 | R |
| 71 | 57.55% | 41.03% | D+16.5 | 50.34% | 43.28% | D+7.1 | D |
| 72 | 48.68% | 50.09% | R+1.4 | 36.95% | 58.55% | R+21.6 | R |
| 73 | 60.93% | 37.66% | D+23.3 | 47.53% | 47.49% | D+0 | D |
| 74 | 57.74% | 40.88% | D+16.9 | 46.22% | 49.38% | R+3.2 | D |
| 75 | 47.55% | 51.22% | R+3.7 | 34.53% | 60.84% | R+26.3 | R |
| 76 | 81.64% | 15.70% | D+65.9 | 82.30% | 11.34% | D+71 | D |
| 77 | 82.23% | 16.20% | D+66 | 83.80% | 11.48% | D+72.3 | D |
| 78 | 71.91% | 26.85% | D+45.1 | 75.62% | 19.47% | D+56.2 | D |
| 79 | 60.89% | 38.29% | D+22.6 | 62.65% | 32.43% | D+30.2 | D |
| 80 | 63.93% | 35.08% | D+28.9 | 62.12% | 32.50% | D+29.6 | D |
| 81 | 61.46% | 37.67% | D+23.8 | 51.23% | 43.11% | D+8.1 | D |
| 82 | 43.03% | 56.32% | R+13.3 | 43.69% | 51.79% | R+8.1 | R |
| 83 | 31.12% | 68.10% | R+37 | 29.71% | 65.91% | R+36.2 | R |
| 84 | 42.31% | 56.84% | R+14.5 | 41.43% | 53.68% | R+12.3 | R |
| 85 | 52.04% | 46.78% | D+5.3 | 44.67% | 49.90% | R+5.2 | R |
| 86 | 43.96% | 55.02% | R+11.1 | 36.19% | 59.18% | R+23 | R |
| 87 | 44.81% | 53.95% | R+9.1 | 30.93% | 64.82% | R+33.9 | R |
| 88 | 48.79% | 50.35% | R+1.6 | 43.75% | 50.75% | R+7 | R |
| 89 | 46.02% | 52.97% | R+6.9 | 32.41% | 63.26% | R+30.9 | R |
| 90 | 63.31% | 35.13% | D+28.2 | 53.29% | 39.82% | D+13.5 | D |
| 91 | 60.63% | 37.68% | D+22.9 | 55.95% | 36.72% | D+19.2 | D |
| 92 | 55.89% | 42.98% | D+12.9 | 40.90% | 54.33% | R+13.4 | R |
| 93 | 47.10% | 51.80% | R+4.7 | 38.30% | 56.18% | R+17.9 | R |
| 94 | 51.53% | 47.32% | D+4.2 | 45.50% | 49.03% | R+3.5 | D |
| 95 | 64.46% | 33.93% | D+30.5 | 58.03% | 34.66% | D+23.4 | D |
| 96 | 55.57% | 42.95% | D+12.6 | 42.90% | 51.64% | R+8.7 | R |
| 97 | 39.90% | 59.02% | R+19.1 | 39.37% | 54.43% | R+15.1 | R |
| 98 | 33.69% | 65.46% | R+31.8 | 35.20% | 59.58% | R+24.4 | R |
| 99 | 26.70% | 72.64% | R+45.9 | 28.97% | 66.40% | R+37.4 | R |
| Total | 52.92% | 45.97% | D+7 | 47.01% | 47.78% | R+0.8 | - |
| Source: Daily Kos | |||||||
Recent news
The link below is to the most recent stories in a Google news search for the terms Racine Unified School District Wisconsin election. These results are automatically generated from Google. Ballotpedia does not curate or endorse these articles.
See also
| Racine Unified School District | Wisconsin | School Boards |
|---|---|---|
 |
||
|
External links
Footnotes
- ↑ The Journal Times, "2018 local and school candidate filings," January 2, 2018
- ↑ 2.0 2.1 Wisconsin Association of School Boards, "Guide for Candidates," accessed November 26, 2017
- ↑ DMV.org, "Voter Registration in Wisconsin," accessed January 22, 2015
- ↑ State statutes stipulate that an individual must have resided in Wisconsin for at least 28 days prior to the election in order to register to vote in that election. However, the United States District Court for the Western District of Wisconsin ruled that "the increase of the durational residency requirement from 10 days to 28 days is unconstitutional." Consequently, the earlier 10-day requirement took effect once again. An appeal of the district court's decision was pending as of September 20, 2016.
- ↑ Wisconsin Statutes, "Section 6.10," accessed November 7, 2016
- ↑ 6.0 6.1 Wisconsin Legislature, "Opportunity Schools and Partnership Program," accessed March 28, 2018
- ↑ Fox 6 Now, "Racine Unified targeted as a failing school district under GOP budget plan," August 28, 2017
- ↑ The Journal Times, "Top stories of 2017 — No. 5: Unified avoids takeover," December 28, 2017
- ↑ National Center for Education Statistics, "Local Education Agency (School District) Universe Survey Data," accessed January 29, 2018
- ↑ 10.0 10.1 10.2 10.3 United States Census Bureau, "Racine County, Wisconsin," accessed December 19, 2016
- ↑ 11.0 11.1 United States Census Bureau, "State & County QuickFacts: USA," accessed July 6, 2015
- ↑ Daily Kos, "Daily Kos Elections' statewide election results by congressional and legislative districts," July 9, 2013
- ↑ Daily Kos, "Daily Kos Elections' 2016 presidential results for congressional and legislative districts," February 6, 2017
| Racine Unified School District elections in 2018 | |
| Racine County, Wisconsin | |
| Election date: | April 3, 2018 |
| Candidates: | District 4: Incumbent, Julie McKenna District 5: Jane Barbian District 6: Incumbent, John Heckenlively |
| Important information: | What was at stake? |

