Scott Rasmussen's Number of the Day for March 24, 2017
The Number of the Day columns published on Ballotpedia reflect the views of the author.
March 24, 2017: News reports have been filled with stories about how President Trump’s initial budget plan increases defense spending dramatically while cutting spending for the State Department, EPA, and other agencies.
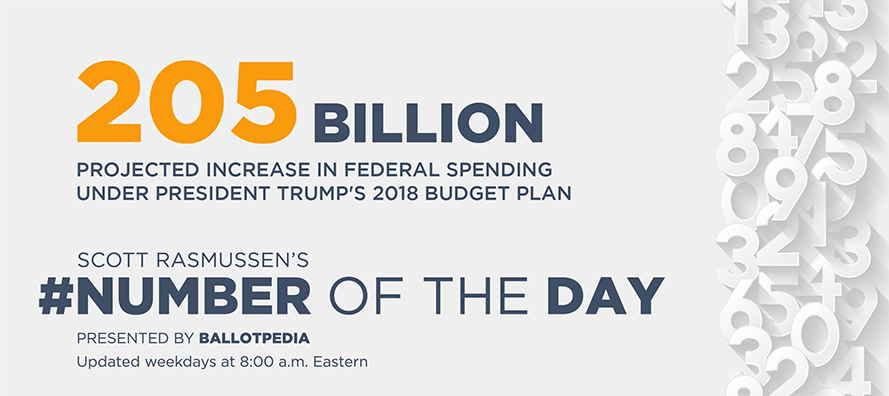
What is rarely noted is that total federal spending will continue to increase. This year (2017), federal spending is expected to exceed $4 trillion for the first time in history. The precise projection, provided by the Obama administration, anticipates spending $4.147 trillion (that’s four trillion, 147 billion). In 2018, those projections anticipate spending $4.352 trillion, an increase of $205 billion.[1]
President Trump’s initial plans do not alter those base numbers at all. They simply funnel more money to defense and less to other areas.
The figures represent a 5 percent increase in spending from the current year, higher even than the rate of inflation. With only a couple of fluke exceptions, federal spending has risen faster than inflation just about every year since the 1960s. Current annual spending is $600 billion higher than when President Obama took office.[1]
The persistent growth in federal spending is rarely reported because the government relies upon what is known as a Current Services Baseline. That means the official figures start by assuming how much government spending will increase every year if no changes are made. If spending grows less than expected, it is considered a budget cut.
Current baseline projections show that federal spending will grow by more than $200 billion every year. Driving these increases are entitlement programs such as Social Security, Medicare, Medicaid, and government pensions. The Committee for a Responsible Federal Budget says these mandatory expenditures account for “70 percent of spending and 90 percent of its growth over the next decade.”[2]
The unstated reality in just about every story about federal budgets is that what politicians call budget cuts almost always mean that spending is growing more slowly than expected.
Since 1956, federal spending has increased in 56 out of 60 years. Three of the four exceptions resulted from accounting practices following the massive bailouts issued during the financial industry meltdown of 2008-2009. However, spending still remained substantially higher than it had been before the bailouts.[1]
| Federal spending increase (millions of dollars)[1] | ||
|---|---|---|
| Spending | Increase | |
| 2013 | 3,454,647 | |
| 2014 | 3,506,114 | 51,467 |
| 2015 | 3,688,292 | 182,178 |
| 2016 estimate | 3,951,307 | 263,015 |
| 2017 estimate | 4,147,224 | 195,917 |
| 2018 estimate | 4,352,222 | 204,998 |
| 2019 estimate | 4,644,309 | 292,087 |
| 2020 estimate | 4,879,818 | 235,509 |
| 2021 estimate | 5,124,248 | 244,430 |
Yesterday’s Number of the Day was 101 minutes, the average time spent in the waiting room and traveling to see a doctor.
Wednesday’s number was 39.3, the gallons of water consumed by the average American in 2016. For the first time ever, Americans consumed more bottled water than soda.
Tuesday’s number was 32.6, the number of years Supreme Court nominee Neil Gorsuch could serve on the court based on life expectancy.
Monday’s number looked at 206 Pivot Counties that voted twice for President Obama and then voted for President Trump in 2016.
Scott Rasmussen’s Number of the Day is published by Ballotpedia weekdays at 8:00 a.m. Eastern. Click here to check out the latest update.
The Number of the Day is broadcast on local stations across the country. An archive of these broadcasts can be found here.
Columns published on Ballotpedia reflect the views of the author.
Ballotpedia is the nonprofit, nonpartisan Encyclopedia of American Politics.
See also
Footnotes
| |||||||||||||||||||||||


