Richard Schier
Ballotpedia provides comprehensive election coverage of the 100 largest cities in America by population as well as mayoral, city council, and district attorney election coverage in state capitals outside of the 100 largest cities. This board member is outside of that coverage scope and does not receive scheduled updates.
Richard "Rick" Schier was a District 2 Position 2 representative on the Olathe Public Schools USD 233 Board of Education in Kansas. He was first elected to the board in April 2011. Schier won re-election unopposed in the general election on April 7, 2015.
Biography
Shcier is the senior vice president of CommunityAmerica Credit Union. He has lived in Johnson County for 19 years and Olathe School District for 15 years. He has his wife have three children. Two of their children attend district schools and the third graduated from them.[1]
Elections
2015
Four seats were up for election on April 7, 2015. A primary election for the at-large Position 7 seat was held March 3, 2015.
Position 1 incumbent LeEtta Felter defeated challenger Jim Poe in her re-election bid, while Position 2 incumbent Richard Schier retained his seat without facing opposition. Shannon Wickliffe won the Position 4 seat as she was the only candidate to file for the open seat.[2]
Four candidates filed for the open at-large Position 7 seat: Joe Beveridge, Scott Enge, Robyn Essex, and Elizabeth Howerton.[2] Because more than three candidates filed for the position, a primary election was held. Essex and Beveridge advanced to the general election, where Beveridge won the seat.
Results
| Olathe Public Schools USD 233, District 2 Position 2 General Election, 4-year term, 2015 |
||||
|---|---|---|---|---|
| Party | Candidate | Vote % | Votes | |
| Nonpartisan | 99.1% | 5,161 | ||
| Nonpartisan | Write-in votes | 0.9% | 47 | |
| Total Votes | 5,208 | |||
| Source: Johnson County Election Office, "Election Summary Report 2015 Spring General," April 13, 2015 | ||||
Funding
Schier reported no contributions or expenditures to the Johnson County Election Office in this election, which left his campaign with $58.64 on hand from his previous campaign.[3]
Endorsements
Schier did not receive any official endorsements in this election.
2011
| Olathe Public Schools USD 233, District 2 Position 2 General Election, 4-year term, 2011 |
||||
|---|---|---|---|---|
| Party | Candidate | Vote % | Votes | |
| Nonpartisan | 61.7% | 3,874 | ||
| Nonpartisan | Lister Potter Jr. | 38.2% | 2,397 | |
| Nonpartisan | Write-in votes | 0.1% | 9 | |
| Total Votes | 6,280 | |||
| Source: Johnson County Elections, "Election Summary Report 2011 Spring General," April 11, 2011 | ||||
About the district
- See also: Olathe Public Schools USD 233, Kansas
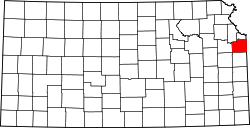
Olathe Public Schools USD 233 is located in Johnson County in northeastern Kansas. The county seat of Johnson County is Olathe. Johnson County was home to an estimated 566,933 residents in 2013, according to the United States Census Bureau.[4] Olathe Public Schools was the fourth-largest school district by enrollment in Kansas and served 28,182 students in the 2011-2012 school year.
Demographics
Johnson County outperformed the rest of Kansas in terms of higher education achievement in 2013. The United States Census Bureau found that 51.7 percent of Johnson County residents aged 25 years and older had attained a bachelor's degree compared to 30.3 percent for Kansas as a whole. The median household income in Johnson County was $74,717 compared to $51,332 for the state of Kansas. The poverty rate in Johnson County was 6.5 percent compared to 13.7 percent for the entire state.[4]
|
| ||||||||||||||||||||||||||||||||||||||||||||||
Note: Percentages for race and ethnicity may add up to more than 100 percent because respondents may report more than one race and the Hispanic/Latino ethnicity may be selected in conjunction with any race. Read more about race and ethnicity in the census here.
See also
- Olathe Public Schools USD 233, Kansas
- Olathe Public Schools USD 233 elections (2015)
- Hot tub Gatorade, turnout in Peoria and the Wisconsin state budget... (April 8, 2015)
External links
Footnotes
- ↑ Olathe Public Schools, "Meet Our Board of Education," accessed February 11, 2015
- ↑ 2.0 2.1 Johnson County Election Office, "Candidates - Spring 2015 Unofficial Listing," accessed January 28, 2015
- ↑ Johnson County Elections Office, " Campaign & Committee Reports," accessed June 1, 2015
- ↑ 4.0 4.1 4.2 United States Census Bureau, "Johnson County, Kansas," accessed December 30, 2014
- ↑ Johnson County Election Office, "Election History by Year," accessed December 30, 2014
