James R. Blatchford
Ballotpedia provides comprehensive election coverage of the 100 largest cities in America by population as well as mayoral, city council, and district attorney election coverage in state capitals outside of the 100 largest cities. This board member is outside of that coverage scope and does not receive scheduled updates.
James R. Blatchford is the former District F member of the Lawrence School Committee. He was first elected to the chamber in 2011 and he won re-election in a primary election on September 17 and a general election on November 5, 2013.
Biography
James Blatchford resides in Lawrence, Massachusetts. He is the current District F member on the School Committee, which he was elected to on November 8, 2011.[1] Blatchford attended Lawrence High School and earned a bachelor's degree in political science from the University of Massachusetts, Lowell.[2] In addition to his position on the School Committee, Blatchford has served as a camp counselor and a Merrimack Valley Youth Court coordinator working with at-risk youth.[3]
Elections
2013
- See also: Lawrence Public Schools elections (2013)
James Blatchford ran unopposed to keep his District F seat in the general election on November 5, 2013.[4]
Results
| Lawrence Public Schools, District F General Election, 2-year term, 2013 | ||||
|---|---|---|---|---|
| Party | Candidate | Vote % | Votes | |
| Nonpartisan | 98.3% | 1,725 | ||
| Nonpartisan | Write-in votes | 1.7% | 29 | |
| Total Votes | 1,754 | |||
| Source: City of Lawrence, Massachusetts, "Official Election Results," accessed December 18, 2013 | ||||
| Lawrence Public Schools, District F Primary Election, 2-year term, 2013 | ||||
|---|---|---|---|---|
| Party | Candidate | Vote % | Votes | |
| Nonpartisan | 97.4% | 1,253 | ||
| Nonpartisan | Write-in votes | 2.6% | 33 | |
| Total Votes | 1,286 | |||
| Source: City of Lawrence, Massachusetts, "Preliminary Election, Lawrence, MA," accessed September 18, 2013 | ||||
Funding
James Blatchford began the race with an existing account balance of $4,114.97 from his previous campaigns. He reported $102.25 in contributions and $252.78 in expenditures to the Lawrence Election Division, which left his campaign with $3,964.44 on hand.[5]
Endorsements
James Blatchford did not receive any official endorsements for his campaign.
2011
| Lawrence Public Schools, District F General Election, 2-year term, 2011 | ||||
|---|---|---|---|---|
| Party | Candidate | Vote % | Votes | |
| Nonpartisan | 97.8% | 976 | ||
| Nonpartisan | Write-in votes | 2.2% | 22 | |
| Total Votes | 998 | |||
| Source: Lawrence Election Division, "2011 Municipal Election - November 8, 2011," accessed August 8, 2013 | ||||
Campaign themes
Blatchford's campaign website listed the following campaign themes:[6]
|
Jim is running for School Committee because Lawrence families deserve accountable leadership that is invested in creating a brighter future for students. |
Note: The above quote is from the candidate's website, which may include some typographical or spelling errors.
About the district
- See also: Lawrence Public Schools, Massachusetts
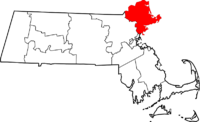
Lawrence Public Schools is located in Essex County, Massachusetts. The county seats of Essex County are Lawrence and Salem. According to the 2010 US Census, Essex County is home to 755,618 residents.[7]
Demographics
Essex County outperformed the rest of Massachusetts in terms of its poverty rate but under performed with regard to median rates of average household income and higher education achievement in 2011. The median household income in Essex County was $65,785 compared to $65,981 for the state of Massachusetts. The poverty rate in Essex County was 10.6% compared to 10.7% for the entire state. The US Census also found that 36.4% of Essex County residents aged 25 years and older attained a Bachelor's degree compared to 38.7% in Massachusetts.[7]
|
| ||||||||||||||||||||||||||||||||||||||||||||||||
Note: Percentages for race and ethnicity may add up to more than 100 percent because respondents may report more than one race and the Hispanic/Latino ethnicity may be selected in conjunction with any race. Read more about race and ethnicity in the census here.
Recent news
This section links to a Google news search for the term "James + Blatchford + Lawrence + Public + School"
See also
External links
Footnotes
- ↑ Lawrence Public Schools, "School Committee," accessed August 8, 2013
- ↑ Facebook, "Jim Blatchford - About," accessed August 13, 2013
- ↑ Vote Jim Blatchford, "About," accessed August 13, 2013
- ↑ Keith Eddings, The Eagle-Tribune, "The field is set: Lantigua will face 5 challengers in primary," August 8, 2013
- ↑ City of Lawrence, Massachusetts, "Campaign Finance Reports Due," accessed December 23, 2013
- ↑ Vote Jim Blatchford, "Home," accessed August 16, 2013
- ↑ 7.0 7.1 7.2 United States Census Bureau, "Essex County, Massachusetts," accessed August 7, 2013
- ↑ Massachusetts Secretary of State, “Enrollment Breakdown as of 2/15/2012,” accessed August 7, 2013
State of Massachusetts Boston (capital) | |
|---|---|
| Elections |
What's on my ballot? | Elections in 2026 | How to vote | How to run for office | Ballot measures |
| Government |
Who represents me? | U.S. President | U.S. Congress | Federal courts | State executives | State legislature | State and local courts | Counties | Cities | School districts | Public policy |
