It’s the 12 Days of Ballotpedia! Your gift powers the trusted, unbiased information voters need heading into 2026. Donate now!
Florida state executive official elections, 2014
2015 →
← 2013
|
| 2014 State Executive Official Elections |
| Alabama • Alaska • Arizona • Arkansas • California • Colorado • Connecticut • Delaware • Florida • Georgia • Hawaii • Idaho • Illinois • Indiana • Iowa • Kansas • Louisiana • Maine • Maryland • Massachusetts • Michigan • Minnesota • Missouri • Montana • Nebraska • Nevada • New Hampshire • New Mexico • New York • North Dakota • Ohio • Oklahoma • Oregon • Pennsylvania • Rhode Island • South Carolina • South Dakota • Tennessee • Texas • Utah • Vermont • Wisconsin • Wyoming |
| Partisan breakdown Candidates by office Voter turnout Key deadlines State executive organization Ballotpedia reports Recent news See also |
| News • Calendar |
Five state executive positions were up for election in 2014 in the state of Florida. The general election took place November 4, 2014, following a primary on August 26. A primary election is an election in which registered voters select a candidate that they believe should be a political party's candidate for elected office to run in the general election. They are also used to choose convention delegates and party leaders. Primaries are state-level and local-level elections that take place prior to a general election. Florida utilizes a closed primary process, in which the selection of a party's candidates in an election is limited to registered party members.[1][2]
For information about which offices are nominated via primary election, see this article.
The following offices were elected in 2014 in Florida:
- Governor of Florida
- Lieutenant Governor of Florida
- Florida Attorney General
- Florida Treasurer
- Florida Agriculture Commissioner
In addition to candidate lists and election results, this page includes information about important dates, how the state's executive branch is organized, as well as links to articles about recent news in races across the state.
Partisan breakdown
Heading into the November 4 election, the Republican Party held five of the five state executive seats in Florida.
| Florida State Executives -- Partisan Breakdown | |||
|---|---|---|---|
| Party | As of November 4, 2014 | After the 2014 Election | |
| Republican Party | 5 | 5 | |
| Democratic Party | 0 | 0 | |
| Total | 5 | 5 | |
Candidates by office
| Office | Incumbent | Assumed Office | Incumbent running? | General Election Candidates | 2015 Winner | Partisan Switch? |
| Governor | Rick Scott  |
2011 | Yes[3] | Glenn Burkett Farid Khavari Piotr Blass Timothy Devine Emelia Harris Monroe Lee Charles Tolbert |
No | |
| Lieutenant Governor | Carlos Lopez-Cantera  |
2014 | Yes | Jose Augusto Matos Lateresa Jones Bob Wirengard Diane Smith Georgianna Harris Juanita Lockett Christine Timmon |
No | |
| Attorney General | Pam Bondi  |
2011 | Yes[4] | No | ||
| Chief Financial Officer | Jeffrey Atwater  |
2011 | Yes[5] | No | ||
| Commissioner of Agriculture and Consumer Services | Adam Putnam  |
2011 | Yes[6][5] | Jeffrey Obos |
No |
Primary election results
Governor
Republican primary
| Governor of Florida, Republican Primary, 2014 | ||||
|---|---|---|---|---|
| Candidate | Vote % | Votes | ||
| 87.6% | 831,887 | |||
| Elizabeth Cuevas-Neunder | 10.6% | 100,496 | ||
| Yinka Adeshina | 1.8% | 16,761 | ||
| Total Votes | 949,144 | |||
| Election results via Florida Division of Elections. | ||||
Democratic primary
| Governor of Florida, Democratic Primary, 2014 | ||||
|---|---|---|---|---|
| Candidate | Vote % | Votes | ||
| 74.4% | 623,001 | |||
| Nan Rich | 25.6% | 214,795 | ||
| Total Votes | 837,796 | |||
| Election results via Florida Division of Elections. | ||||
Attorney General
Republican primary
- Uncontested
Democratic primary
| Florida Attorney General, Democratic Primary, 2014 | ||||
|---|---|---|---|---|
| Candidate | Vote % | Votes | ||
| 60.7% | 457,811 | |||
| Perry Thurston | 39.3% | 296,907 | ||
| Total Votes | 754,718 | |||
| Election results via Florida Division of Elections. | ||||
Treasurer
Republican primary
- Uncontested
Democratic primary
- Uncontested
Florida Agriculture Commissioner
Republican primary
- Uncontested
Democratic primary
- Uncontested
General election results
The general election took place on November 4, 2014.
Governor and Lieutenant Governor
| Governor and Lieutenant Governor of Florida, 2014 | ||||
|---|---|---|---|---|
| Party | Candidate | Vote % | Votes | |
| Republican | 48.1% | 2,865,343 | ||
| Democratic | Charlie Crist/Annette Taddeo-Goldstein | 47.1% | 2,801,198 | |
| Libertarian | Adrian Wyllie/Greg Roe | 3.8% | 223,356 | |
| No Party Affiliation | Glenn Burkett/Jose Augusto Matos | 0.7% | 41,341 | |
| No Party Affiliation | Farid Khavari/Lateresa Jones | 0.3% | 20,186 | |
| Nonpartisan | Write-in votes | 0% | 137 | |
| Total Votes | 5,951,561 | |||
| Election results via Florida Division of Elections | ||||
Attorney General
| Attorney General of Florida, 2014 | ||||
|---|---|---|---|---|
| Party | Candidate | Vote % | Votes | |
| Republican | 55.1% | 3,222,524 | ||
| Democratic | George Sheldon | 42% | 2,457,317 | |
| Libertarian | Bill Wohlsifer | 2.9% | 169,394 | |
| Total Votes | 5,849,235 | |||
| Election results via Florida Division of Elections | ||||
Treasurer
| Florida Treasurer, 2014 | ||||
|---|---|---|---|---|
| Party | Candidate | Vote % | Votes | |
| Republican | 58.9% | 3,353,897 | ||
| Democratic | William "Will" Rankin | 41.1% | 2,337,727 | |
| Total Votes | 5,691,624 | |||
| Election results via Florida Division of Elections | ||||
Florida Agriculture Commissioner
| Agriculture Commissioner of Florida, 2014 | ||||
|---|---|---|---|---|
| Party | Candidate | Vote % | Votes | |
| Republican | 58.7% | 3,342,392 | ||
| Democratic | Thad Hamilton | 41.3% | 2,356,178 | |
| Nonpartisan | Write-in votes | 0% | 213 | |
| Total Votes | 5,698,783 | |||
| Election results via Florida Division of Elections | ||||
Voter turnout
Political scientist Michael McDonald's United States Elections Project studied voter turnout in the 2014 election by looking at the percentage of eligible voters who headed to the polls. McDonald used voting-eligible population (VEP), or the number of eligible voters independent of their current registration status, to calculate turnout rates in each state on November 4. He also incorporated ballots cast for the highest office in each state into his calculation. He estimated that 81,687,059 ballots were cast in the 50 states plus the District of Columbia, representing 35.9 percent of the VEP.[7] By comparison, 61.6 percent of VEP voted in the 2008 presidential election and 58.2 percent of VEP voted in the 2012 presidential election.[8]
Quick facts
- According to PBS Newshour, voter turnout in the 2014 midterms was the lowest since the 1942 midterms, which took place during the nation's involvement in World War II.[9]
- Forty-three states and the District of Columbia did not surpass 50 percent turnout in McDonald's analysis.
- The three states with the lowest turnout according to McDonald's analysis were Texas (28.3 percent), Tennessee (28.6 percent), and Indiana (28.8 percent).
- Maine (58.5 percent), Wisconsin (56.5 percent), and Colorado (54.5 percent) were the three states with the highest turnout.
- Twelve states increased voter turnout in 2014 compared to the 2010 midterm elections.[10]
| Voter turnout rates, 2014 | |||||
|---|---|---|---|---|---|
| State | Total votes counted | % voter eligible population | Top statewide office up for election | Size of lead (Raw votes) | Size of lead (%) |
| Alabama | 1,191,274 | 33.2 | Governor | 320,319 | 27.2 |
| Alaska | 285,431 | 54.4 | Governor | 4,004 | 1.6 |
| Arizona | 1,537,671 | 34.1 | Governor | 143,951 | 12.5 |
| Arkansas | 852,642 | 40.1 | Governor | 118,664 | 14.0 |
| California | 7,513,972 | 30.8 | Governor | 1,065,748 | 17.8 |
| Colorado | 2,080,071 | 54.5 | Governor | 50,395 | 2.4 |
| Connecticut | 1,096,509 | 42.5 | Governor | 26,603 | 2.5 |
| Delaware | 234,038 | 34.4 | Attorney General | 31,155 | 13.6 |
| District of Columbia | 177,176 | 35.8 | Mayor | 27,934 | 19.0 |
| Florida | 6,026,802 | 43.3 | Governor | 66,127 | 1.1 |
| Georgia | 2,596,947 | 38.5 | Governor | 202,685 | 8.0 |
| Hawaii | 369,554 | 36.5 | Governor | 45,323 | 12.4 |
| Idaho | 445,307 | 39.6 | Governor | 65,852 | 14.9 |
| Illinois | 3,680,417 | 40.9 | Governor | 171,900 | 4.9 |
| Indiana | 1,387,622 | 28.8 | Secretary of State | 234,978 | 17.8 |
| Iowa | 1,142,284 | 50.2 | Governor | 245,548 | 21.8 |
| Kansas | 887,023 | 43.4 | Governor | 33,052 | 3.9 |
| Kentucky | 1,435,868 | 44.0 | U.S. Senate | 222,096 | 15.5 |
| Louisiana | 1,472,039 | 43.8 | U.S. Senate | 16,401 | 1.1 |
| Maine | 616,996 | 58.5 | Governor | 29,820 | 4.9 |
| Maryland | 1,733,177 | 41.5 | Governor | 88,648 | 6.1 |
| Massachusetts | 2,186,789 | 44.6 | Governor | 40,361 | 1.9 |
| Michigan | 3,188,956 | 43.2 | Governor | 129,547 | 4.3 |
| Minnesota | 1,992,613 | 50.5 | Governor | 109,776 | 5.6 |
| Mississippi | 631,858 | 28.9 | U.S. Senate | 141,234 | 33.0 |
| Missouri | 1,426,303 | 31.8 | Auditor | 684,074 | 53.6 |
| Montana | 373,831 | 47.3 | U.S. Senate | 65,262 | 17.9 |
| Nebraska | 552,115 | 41.5 | Governor | 97,678 | 18.7 |
| Nevada | 547,349 | 29.0 | Governor | 255,793 | 46.7 |
| New Hampshire | 495,565 | 48.4 | Governor | 24,924 | 5.2 |
| New Jersey | 1,955,042 | 32.5 | N/A | N/A | N/A |
| New Mexico | 512,805 | 35.7 | Governor | 73,868 | 14.6 |
| New York | 3,930,310 | 29.0 | Governor | 476,252 | 13.4 |
| North Carolina | 2,939,767 | 41.2 | U.S. Senate | 48,511 | 1.7 |
| North Dakota | 255,128 | 45.0 | U.S. House At-large seat | 42,214 | 17.1 |
| Ohio | 3,149,876 | 36.2 | Governor | 933,235 | 30.9 |
| Oklahoma | 824,831 | 29.8 | Governor | 122,060 | 14.7 |
| Oregon | 1,541,782 | 53.5 | Governor | 59,029 | 4.5 |
| Pennsylvania | 3,495,866 | 36.0 | Governor | 339,261 | 9.8 |
| Rhode Island | 329,212 | 42.2 | Governor | 14,346 | 4.5 |
| South Carolina | 1,261,611 | 35.2 | Governor | 179,089 | 14.6 |
| South Dakota | 282,291 | 44.9 | Governor | 124,865 | 45.1 |
| Tennessee | 1,374,065 | 28.6 | Governor | 642,214 | 47.5 |
| Texas | 4,727,208 | 28.3 | Governor | 957,973 | 20.4 |
| Utah | 577,973 | 30.2 | Attorney General | 173,819 | 35.2 |
| Vermont | 193,087 | 38.8 | Governor | 2,095 | 1.1 |
| Virginia | 2,194,346 | 36.6 | U.S. Senate | 16,727 | 0.8 |
| Washington | 2,123,901 | 43.1 | N/A | N/A | N/A |
| West Virginia | 451,498 | 31.2 | U.S. Senate | 124,667 | 27.6 |
| Wisconsin | 2,410,314 | 56.5 | Governor | 137,607 | 5.7 |
| Wyoming | 168,390 | 39.3 | Governor | 52,703 | 33.6 |
Note: Information from the United States Elections Project was last updated on December 16, 2014.
Key deadlines
| Deadline | Event |
|---|---|
| June 20, 2014 | Filing deadline |
| August 26, 2014 | Primary election |
| November 4, 2014 | General election |
| November 18, 2014 | State Election Canvassing Commission meets to certify official results |
| January 6, 2015 | Inauguration day for state executive officials in general election |
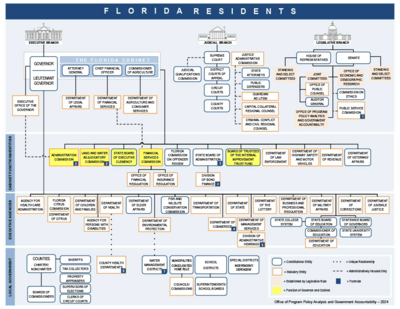
State executive organization
Executive officials in Florida are part of a three-pronged government structure that includes state legislators and state judges. The following chart details the relationship among different branches of Florida's state government:
Ballotpedia reports
To learn more about developments in these races, check out the following news articles from Ballotpedia:
- Scott and Crist to vie for vulnerable governor seat this fall: Florida state executive primary elections review
- Rick Scott unveils identity of new lieutenant governor after ten month vacancy
Recent news
This section links to a Google news search for the term "Florida + state + executive + elections"
See also

Footnotes
- ↑ The Florida Senate, "Fla. Stat. § 101.021," accessed November 26, 2025
- ↑ The Florida Senate, "Fla. Stat. § 97.055," accessed November 26, 2025
- ↑ Sabato's Crystal Ball, "2013-2014 Gubernatorial Races," March 4, 2013
- ↑ Pam Bondi for Attorney General 2014 Official campaign website, "Homepage," accessed September 30, 2013
- ↑ 5.0 5.1 Sunshine State News, "Jeff Atwater Can Use 2014 as a Springboard for Higher Office," July 30, 2013 Cite error: Invalid
<ref>tag; name "ssn" defined multiple times with different content - ↑ Adam Putnam for Commissioner 2014 Official campaign website, "Homepage," accessed September 30, 2013
- ↑ United States Elections Project, "2014 November General Election Turnout Rates," November 7, 2014
- ↑ TIME, "Voter Turnout in Midterm Elections Hits 72-Year Low," November 10, 2014
- ↑ PBS, "2014 midterm election turnout lowest in 70 years," November 10, 2014
- ↑ U.S. News & World Report, "Midterm Turnout Down in 2014," November 5, 2014
