Troy School District, Michigan
Ballotpedia provides comprehensive election coverage of the 100 largest cities in America by population as well as mayoral, city council, and district attorney election coverage in state capitals outside of the 100 largest cities. This school district is outside of that coverage scope and does not receive scheduled updates.
| Troy School District |
|---|
| Oakland County, Michigan |
| District details |
| Superintendent: Dr. Richard Machesky |
| # of school board members: 7 |
| Website: Link |
Troy School District is a school district in Michigan that served 12,320 students in 20 schools during the 2012-2013 school year.[1] This district was the 13th-largest by enrollment in the state of Michigan.
About the district
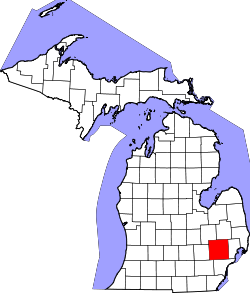
Troy School District is located in Oakland County, Mich. The county seat is Pontiac. Oakland County was home to 1,237,868 residents in 2014, according to the United States Census Bureau.[2]
Demographics
Oakland County outperformed compared to Michigan as a whole in terms of higher education achievement from 2009 to 2013. The United States Census Bureau found that 43.1 percent of county residents aged 25 years and older had attained a bachelor's degree compared to 25.9 percent for state residents. The median household income for the county was $65,594 compared to $48,411 for the state. The percentage of people below poverty level for the county was 10.3 percent while it was 16.8 percent for the state.[2]
|
| ||||||||||||||||||||||||||||||||||||||||||||||
Note: Percentages for race and ethnicity may add up to more than 100 percent because respondents may report more than one race and the Hispanic/Latino ethnicity may be selected in conjunction with any race. Read more about race and ethnicity in the census here.
Superintendent
| |
This information is updated as we become aware of changes. Please contact us with any updates. |
The superintendent of Troy School District is Dr. Richard Machesky.[4]
School board elections
Troy School District schools are overseen by a seven-member board elected to six-year terms.
| Troy School District Board of Education | |||
|---|---|---|---|
| Member | |||
| Elizabeth Hammond | |||
| Paula Fleming | |||
| Gary Hauff | |||
| Todd Miletti | |||
| Nancy Philippart | |||
| Karl Schmidt | |||
| Steve Gottlieb | |||
=
| |
This officeholder information was last updated on April 10, 2018. Please contact us with any updates. | |
Election dates
=
- See also: Troy School District elections (2016)
Members of the board are elected at large to staggered six-year terms. Two of the seven board seats were up for election on November 8, 2016.
Budget
From 1993 to 2013, the Troy School District had an average of $137,186,476 in revenue and $138,248,762 in expenditures, according to the United States Census Bureau's survey of school system finances. The district had a yearly average of $122,968,238 in outstanding debt. The district retired $10,066,905 of its debt and issued $14,780,905 in new debt each year on average.[5]
Revenue
The table below separates the district's revenue into the three sources identified by the agency: local, state, and federal.
| Revenue by Source | |||||||||||
|---|---|---|---|---|---|---|---|---|---|---|---|
| Fiscal Year |
Local | State | Federal | Revenue Total | |||||||
| Total | % of Revenue | Total | % of Revenue | Total | % of Revenue | ||||||
| Click [show] on the right to display the revenue data for prior years. | |||||||||||
|---|---|---|---|---|---|---|---|---|---|---|---|
| 1993 | $91,294,000 | 92.05% | $6,770,000 | 6.83% | $1,118,000 | 1.13% | $99,182,000 | ||||
| 1994 | $94,584,000 | 92.64% | $6,573,000 | 6.44% | $938,000 | 0.92% | $102,095,000 | ||||
| 1995 | $52,713,000 | 49.40% | $51,606,000 | 48.36% | $2,389,000 | 2.24% | $106,708,000 | ||||
| 1996 | $53,912,000 | 48.51% | $55,721,000 | 50.14% | $1,492,000 | 1.34% | $111,125,000 | ||||
| 1997 | $55,498,000 | 48.66% | $57,165,000 | 50.12% | $1,390,000 | 1.22% | $114,053,000 | ||||
| 1998 | $64,859,000 | 50.19% | $62,929,000 | 48.70% | $1,429,000 | 1.11% | $129,217,000 | ||||
| 1999 | $68,288,000 | 53.43% | $56,854,000 | 44.48% | $2,677,000 | 2.09% | $127,819,000 | ||||
| 2000 | $68,871,000 | 53.70% | $56,848,000 | 44.33% | $2,526,000 | 1.97% | $128,245,000 | ||||
| 2001 | $70,248,000 | 52.63% | $60,137,000 | 45.05% | $3,099,000 | 2.32% | $133,484,000 | ||||
| 2002 | $72,896,000 | 52.47% | $62,849,000 | 45.24% | $3,190,000 | 2.30% | $138,935,000 | ||||
| 2003 | $74,051,000 | 52.99% | $62,416,000 | 44.66% | $3,279,000 | 2.35% | $139,746,000 | ||||
| 2004 | $76,633,000 | 53.83% | $62,804,000 | 44.11% | $2,931,000 | 2.06% | $142,368,000 | ||||
| 2005 | $84,101,000 | 55.77% | $63,708,000 | 42.25% | $2,997,000 | 1.99% | $150,806,000 | ||||
| 2006 | $85,923,000 | 55.63% | $65,005,000 | 42.09% | $3,517,000 | 2.28% | $154,445,000 | ||||
| 2007 | $88,973,000 | 55.17% | $68,528,000 | 42.49% | $3,762,000 | 2.33% | $161,263,000 | ||||
| 2008 | $88,401,000 | 54.84% | $68,920,000 | 42.75% | $3,889,000 | 2.41% | $161,210,000 | ||||
| 2009 | $79,861,000 | 50.20% | $69,556,000 | 43.72% | $9,671,000 | 6.08% | $159,088,000 | ||||
| 2010 | $79,317,000 | 50.69% | $67,206,000 | 42.95% | $9,949,000 | 6.36% | $156,472,000 |
| 2011 | $74,041,000 | 46.89% | $74,091,000 | 46.92% | $9,785,000 | 6.20% | $157,917,000 |
| 2012 | $69,984,000 | 45.59% | $79,101,000 | 51.52% | $4,438,000 | 2.89% | $153,523,000 |
| 2013 | $65,555,000 | 42.79% | $83,447,000 | 54.46% | $4,213,000 | 2.75% | $153,215,000 |
| Avg. | $74,285,857 | 55.15% | $59,154,000 | 42.27% | $3,746,619 | 2.59% | $137,186,476 |
Expenditures
The table below separates the district's expenditures into five categories identified by the agency:
- Instruction: operation expenditures, state payments on behalf of the district for instruction and benefits, and retirement system transfers
- Support Services: support services, food services, and retirement system transfers for support service staff
- Capital Spending: capital outlay expenditures (i.e., construction, land or facilities purchases, and equipment purchases)
- Debt & Gov. Payments: payments to state and local governments and interest on school system debt
- Other: all other non-K-12 programs, except food services
| Expenditures by Category | |||||||||||
|---|---|---|---|---|---|---|---|---|---|---|---|
| Fiscal Year |
Instruction | Support Services | Capital Spending | Debt & Gov. Payments | Other | Budget Total | |||||
| Total | % of Budget | Total | % of Budget | Total | % of Budget | Total | % of Budget | Total | % of Budget | ||
| Click [show] on the right to display the expenditure data for prior years. | |||||||||||
|---|---|---|---|---|---|---|---|---|---|---|---|
| 1993 | $51,842,000 | 52.97% | $30,879,000 | 31.55% | $7,403,000 | 7.56% | $5,404,000 | 5.52% | $2,335,000 | 2.39% | $97,863,000 |
| 1994 | $54,554,000 | 53.34% | $30,625,000 | 29.94% | $10,700,000 | 10.46% | $3,935,000 | 3.85% | $2,465,000 | 2.41% | $102,279,000 |
| 1995 | $55,571,000 | 56.06% | $33,422,000 | 33.71% | $3,208,000 | 3.24% | $3,703,000 | 3.74% | $3,230,000 | 3.26% | $99,134,000 |
| 1996 | $58,649,000 | 57.47% | $33,220,000 | 32.55% | $2,678,000 | 2.62% | $3,843,000 | 3.77% | $3,665,000 | 3.59% | $102,055,000 |
| 1997 | $60,519,000 | 56.90% | $33,713,000 | 31.70% | $3,197,000 | 3.01% | $5,390,000 | 5.07% | $3,537,000 | 3.33% | $106,356,000 |
| 1998 | $60,530,000 | 53.04% | $34,518,000 | 30.25% | $5,640,000 | 4.94% | $7,615,000 | 6.67% | $5,816,000 | 5.10% | $114,119,000 |
| 1999 | $63,050,000 | 41.77% | $36,960,000 | 24.49% | $34,676,000 | 22.97% | $10,521,000 | 6.97% | $5,725,000 | 3.79% | $150,932,000 |
| 2000 | $67,229,000 | 49.66% | $39,125,000 | 28.90% | $17,804,000 | 13.15% | $5,771,000 | 4.26% | $5,453,000 | 4.03% | $135,382,000 |
| 2001 | $68,256,000 | 51.77% | $41,122,000 | 31.19% | $7,978,000 | 6.05% | $7,514,000 | 5.70% | $6,966,000 | 5.28% | $131,836,000 |
| 2002 | $69,214,000 | 51.05% | $42,949,000 | 31.68% | $9,828,000 | 7.25% | $5,014,000 | 3.70% | $8,580,000 | 6.33% | $135,585,000 |
| 2003 | $73,109,000 | 52.86% | $45,431,000 | 32.85% | $6,072,000 | 4.39% | $4,670,000 | 3.38% | $9,031,000 | 6.53% | $138,313,000 |
| 2004 | $76,462,000 | 54.48% | $48,035,000 | 34.22% | $2,891,000 | 2.06% | $4,305,000 | 3.07% | $8,668,000 | 6.18% | $140,361,000 |
| 2005 | $84,697,000 | 55.30% | $50,550,000 | 33.01% | $4,342,000 | 2.84% | $5,087,000 | 3.32% | $8,472,000 | 5.53% | $153,148,000 |
| 2006 | $78,897,000 | 48.44% | $50,714,000 | 31.14% | $18,954,000 | 11.64% | $5,943,000 | 3.65% | $8,356,000 | 5.13% | $162,864,000 |
| 2007 | $80,777,000 | 41.98% | $51,381,000 | 26.70% | $44,026,000 | 22.88% | $7,855,000 | 4.08% | $8,386,000 | 4.36% | $192,425,000 |
| 2008 | $82,205,000 | 46.51% | $51,568,000 | 29.18% | $27,191,000 | 15.39% | $7,728,000 | 4.37% | $8,040,000 | 4.55% | $176,732,000 |
| 2009 | $88,785,000 | 52.61% | $52,688,000 | 31.22% | $10,115,000 | 5.99% | $7,336,000 | 4.35% | $9,821,000 | 5.82% | $168,745,000 |
| 2010 | $83,312,000 | 54.40% | $48,389,000 | 31.60% | $3,348,000 | 2.19% | $6,881,000 | 4.49% | $11,219,000 | 7.33% | $153,149,000 |
| 2011 | $84,454,000 | 55.47% | $46,178,000 | 30.33% | $3,666,000 | 2.41% | $6,357,000 | 4.18% | $11,585,000 | 7.61% | $152,240,000 |
| 2012 | $82,142,000 | 56.53% | $44,454,000 | 30.59% | $4,553,000 | 3.13% | $5,796,000 | 3.99% | $8,365,000 | 5.76% | $145,310,000 |
| 2013 | $86,223,000 | 59.71% | $45,503,000 | 31.51% | $715,000 | 0.50% | $4,470,000 | 3.10% | $7,485,000 | 5.18% | $144,396,000 |
| Avg. | $71,927,476 | 52.49% | $42,448,762 | 30.87% | $10,904,048 | 7.36% | $5,958,952 | 4.34% | $7,009,524 | 4.93% | $138,248,762 |
Debt
The table below shows the amount of debt retired, issued, and outstanding in the district for each year.
| Debt | |||
|---|---|---|---|
| Fiscal Year |
Retired | Issued | Outstanding |
| Click [show] on the right to display the debt data for prior years. | |||
|---|---|---|---|
| 1993 | $3,700,000 | $0 | $75,215,000 |
| 1994 | $625,000 | $0 | $74,590,000 |
| 1995 | $5,221,000 | $0 | $69,369,000 |
| 1996 | $5,105,000 | $0 | $64,264,000 |
| 1997 | $5,390,000 | $0 | $59,220,000 |
| 1998 | $19,545,000 | $85,965,000 | $125,640,000 |
| 1999 | $11,105,000 | $0 | $181,833,000 |
| 2000 | $7,391,000 | $0 | $111,541,000 |
| 2001 | $7,065,000 | $0 | $104,410,000 |
| 2002 | $7,765,000 | $0 | $96,645,000 |
| 2003 | $8,110,000 | $0 | $88,535,000 |
| 2004 | $21,415,000 | $13,375,000 | $80,495,000 |
| 2005 | $10,740,000 | $104,884,000 | $187,579,000 |
| 2006 | $11,885,000 | $56,610,000 | $232,305,000 |
| 2007 | $16,115,000 | $5,985,000 | $160,660,000 |
| 2008 | $10,165,000 | $0 | $150,495,000 |
| 2009 | $11,035,000 | $0 | $207,420,000 |
| 2010 | $11,495,000 | $0 | $195,925,000 |
| 2011 | $11,956,000 | $0 | $104,084,000 |
| 2012 | $12,491,000 | $0 | $91,089,000 |
| 2013 | $13,086,000 | $43,580,000 | $121,019,000 |
| Avg. | $10,066,905 | $14,780,905 | $122,968,238 |
Teacher salaries
The teacher salary schedule in Troy School District is based on coursework completed beyond a bachelor's degree. A teacher can earn a higher salary by pursuing graduate work, a master's degree, and a doctorate. The table below shows the salary schedule for teachers in the district for the 2015-2016 school year. Numbers listed in addition to a degree indicate the number of graduate credits required to enter that salary range.[6]
| Troy School District 2015-2016 Salary Structure | |||||
|---|---|---|---|---|---|
| Degree level | Minimum salary ($) | Maximum salary ($) | |||
| B.A. | 41,300 | 72,500 | |||
| B.A. + 20 | 43,000 | 78,750 | |||
| M.A. | 45,000 | 84,000 | |||
| M.A. + 30/Ed.S. | 48,200 | 92,400 | |||
| Ph.D./Ed.D. | 51,500 | 95,700 | |||
Contact information
![]()
Troy School District
4400 Livernois Rd.
Troy, MI 48098
Phone: (248) 823-4000
See also
| Michigan | School Board Elections | News and Analysis |
|---|---|---|
 |
 | |
|
Troy School District |
External links
- Troy School District
- Oakland County, Michigan
- Oakland County Clerk
- Michigan Department of Education
- MI School Data
- Michigan Association of School Boards
Footnotes
- ↑ National Center for Education Statistics, "ELSI Table Generator," accessed June 17, 2014
- ↑ 2.0 2.1 2.2 United States Census Bureau, "Oakland County, Michigan," accessed September 25, 2015
- ↑ Secretary of State - Department of State, "Previous Election Information," accessed August 1, 2014
- ↑ Troy School District, "Superintendent's Welcome," accessed June 28, 2016
- ↑ United States Census Bureau, "Public School System Finances: Historical Data," accessed December 1, 2015
- ↑ Troy School District, "Troy Education Association," accessed April 14, 2016
| |||||
 |
State of Michigan Lansing (capital) |
|---|---|
| Elections |
What's on my ballot? | Elections in 2026 | How to vote | How to run for office | Ballot measures |
| Government |
Who represents me? | U.S. President | U.S. Congress | Federal courts | State executives | State legislature | State and local courts | Counties | Cities | School districts | Public policy |
|
This school board-related article is a sprout; we plan on making it grow in the future. If you would like to help it grow, please consider donating to Ballotpedia. |
