Colorado's 3rd Congressional District
| Colorado's 3rd Congressional District |
|---|
 |
| Incumbent Scott Tipton Cook Partisan Voter Index (2018): R+6 |
| U.S. Census Bureau (2010 data)[1] |
| Population: 719,526 |
| Gender: 50.5% Male, 49.5% Female |
| Race[2]: 88.2% White, 2.3% Native Am. |
| Ethnicity: 24.3% Hispanic |
| Unemployment: 10.2% |
| Median household income $47,012 |
| High school graduation rate 88.7% |
| College graduation rate 29.9% |
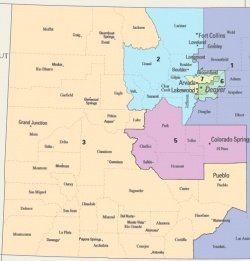
As of the 2010 redistricting cycle, Colorad's 3rd Congressional District was located in western and southern Colorado and included Alamosa, Archuleta, Conejos, Costilla, Custer, Delta, Dolores, Garfield, Gunnison, Hinsdale, Huerfano, Jackson, La Plata, Lake, Mesa, Mineral, Moffat, Montezuma, Montrose, Ouray, Pitkin, Pueblo, Rio Blanco, Rio Grande, Routt, Saguache, San Juan, and San Miguel counties. A portion of Eagle County was also included in the district. [3]
The current representative of the 3rd Congressional District is Scott Tipton (R).
2016 Pivot Counties
Following the 2016 election, this district was one of 105 congressional districts that, based on boundaries adopted after the 2010 census, intersected with one or more Pivot Counties. These 206 Pivot Counties voted for Donald Trump (R) in 2016 after voting for Barack Obama (D) in 2008 and 2012.
The 206 Pivot Counties are located in 34 states. Iowa, with 31, had the most such counties. The partisan makeup of the 109 congressional districts intersecting with Pivot Counties was more Republican than the partisan breakdown of the U.S. House following the 2016 election. Of the 109 congressional districts that had at least one Pivot County, 64 percent were held by a Republican incumbent, while 55.4 percent of U.S. House seats were won by a Republican in the 2016 elections.[4]
Elections
2018
General election
General election candidates
- Scott Tipton (Incumbent) (Republican Party) ✔
- Diane Mitsch Bush (Democratic Party)

- Gaylon Kent (Libertarian Party)
- Mary Malarsie (Independent)
Did not make the ballot:
- Allen Tompkins (Unaffiliated)
![]() = candidate completed Ballotpedia's Candidate Connection survey
= candidate completed Ballotpedia's Candidate Connection survey
Write-in candidates
Primary candidates
![]() Democratic primary candidates
Democratic primary candidates
![]() = candidate completed Ballotpedia's Candidate Connection survey
= candidate completed Ballotpedia's Candidate Connection survey
![]() Republican primary candidates
Republican primary candidates
- Scott Tipton (Incumbent) ✔
![]() Libertarians
Libertarians
![]() Independent
Independent
![]() Unaffiliated
Unaffiliated
2016
Heading into the election, Ballotpedia rated this race as safely Republican. Incumbent Scott Tipton (R) defeated Gail Schwartz (D) and Gaylon Kent (L) in the general election on November 8, 2016. Tipton defeated Alex Beinstein in the Republican primary on June 28, 2016.[6][7][8]
| Party | Candidate | Vote % | Votes | |
|---|---|---|---|---|
| Republican | 54.6% | 204,220 | ||
| Democratic | Gail Schwartz | 40.3% | 150,914 | |
| Libertarian | Gaylon Kent | 5.1% | 18,903 | |
| Total Votes | 374,037 | |||
| Source: Colorado Secretary of State | ||||
| Candidate | Vote % | Votes | ||
|---|---|---|---|---|
|
|
78.9% | 43,992 | ||
| Alex Beinstein | 21.1% | 11,790 | ||
| Total Votes | 55,782 | |||
| Source: Colorado Secretary of State |
||||
2014
The 3rd Congressional District of Colorado held an election for the U.S. House of Representatives on November 4, 2014. Incumbent Scott Tipton (R) defeated Abel Tapia (D), Travis Mero (L) and Tisha Casida (I) in the general election.
| Party | Candidate | Vote % | Votes | |
|---|---|---|---|---|
| Republican | 58% | 163,011 | ||
| Democratic | Abel Tapia | 35.7% | 100,364 | |
| Independent | Tisha Casida | 4% | 11,294 | |
| Libertarian | Travis Mero | 2.3% | 6,472 | |
| Total Votes | 281,141 | |||
| Source: Colorado Secretary of State | ||||
2012
The 3rd Congressional District of Colorado held an election for the U.S. House of Representatives on November 6, 2012. Incumbent Scott Tipton won re-election in the district.[9]
| Party | Candidate | Vote % | Votes | |
|---|---|---|---|---|
| Democratic | Sal Pace | 41.1% | 142,619 | |
| Republican | 53.4% | 185,291 | ||
| Libertarian | Gregory Gilman | 2.4% | 8,212 | |
| Independent | Tisha Casida | 3.2% | 11,125 | |
| Total Votes | 347,247 | |||
| Source: Colorado Secretary of State "Official Election Results, 2012 General Election" | ||||
2010
On November 2, 2010, Scott Tipton won election to the United States House. He defeated incumbent John Salazar (D), Gregory Gilman (L), Jake Segrest (Unaffiliated), John Hargis Sr. (Write-in) and James Fritz (Write-in) in the general election.[10]
| U.S. House, Colorado District 3 General Election, 2010 | ||||
|---|---|---|---|---|
| Party | Candidate | Vote % | Votes | |
| Republican | 50.1% | 129,257 | ||
| Democratic | John Salazar incumbent | 45.8% | 118,048 | |
| Libertarian | Gregory Gilman | 2.2% | 5,678 | |
| Unaffiliated | Jake Segrest | 1.9% | 4,982 | |
| Write-in | John Hargis Sr. | 0% | 23 | |
| Write-in | James Fritz | 0% | 11 | |
| Total Votes | 257,999 | |||
2008
On November 4, 2008, John Salazar won re-election to the United States House. He defeated Wayne Wolf (R) in the general election.[11]
| U.S. House, Colorado District 3 General Election, 2008 | ||||
|---|---|---|---|---|
| Party | Candidate | Vote % | Votes | |
| Democratic | 61.6% | 203,455 | ||
| Republican | Wayne Wolf | 38.4% | 126,762 | |
| Total Votes | 330,217 | |||
2006
On November 7, 2006, John Salazar won re-election to the United States House. He defeated Scott Tipton (R), Bert Sargent (L) and Bruce Lohmiller (G) in the general election.[12]
| U.S. House, Colorado District 3 General Election, 2006 | ||||
|---|---|---|---|---|
| Party | Candidate | Vote % | Votes | |
| Democratic | 61.6% | 146,488 | ||
| Republican | Scott Tipton | 36.5% | 86,930 | |
| Libertarian | Bert Sargent | 1.9% | 4,417 | |
| Green | Bruce Lohmiller | 0% | 23 | |
| Total Votes | 237,858 | |||
2004
On November 2, 2004, John Salazar won election to the United States House. He defeated Greg Walcher (R) and Jim Krug (Unaffiliated) in the general election.[13]
| U.S. House, Colorado District 3 General Election, 2004 | ||||
|---|---|---|---|---|
| Party | Candidate | Vote % | Votes | |
| Democratic | 50.6% | 153,500 | ||
| Republican | Greg Walcher | 46.6% | 141,376 | |
| Unaffiliated | Jim Krug | 2.9% | 8,770 | |
| Total Votes | 303,646 | |||
2002
On November 5, 2002, Scott McInnis won re-election to the United States House. He defeated Denis Berckefeldt (D), J. Brent Shroyer (L), Gary Swing (Natural Law) and Jason Alessio (Write-in) in the general election.[14]
| U.S. House, Colorado District 3 General Election, 2002 | ||||
|---|---|---|---|---|
| Party | Candidate | Vote % | Votes | |
| Republican | 65.8% | 143,433 | ||
| Democratic | Denis Berckefeldt | 31.3% | 68,160 | |
| Libertarian | J. Brent Shroyer | 2% | 4,370 | |
| Natural Law | Gary Swing | 0.9% | 1,903 | |
| Write-in | Jason Alessio | 0% | 106 | |
| Total Votes | 217,972 | |||
2000
On November 7, 2000, Scott McInnis won re-election to the United States House. He defeated Curtis Imrie (D), Drew Saskon (L) and Victor Good (Reform) in the general election.[15]
| U.S. House, Colorado District 3 General Election, 2000 | ||||
|---|---|---|---|---|
| Party | Candidate | Vote % | Votes | |
| Republican | 65.8% | 199,204 | ||
| Democratic | Curtis Imrie | 29.1% | 87,921 | |
| Libertarian | Drew Saskon | 3.3% | 9,982 | |
| Reform | Victor Good | 1.8% | 5,433 | |
| Total Votes | 302,540 | |||
1998
On November 3, 1998, Scott McInnis won re-election to the United States House. He defeated Robert Reed Kelley (D) and Barry Maggert (L) in the general election.[16]
| U.S. House, Colorado District 3 General Election, 1998 | ||||
|---|---|---|---|---|
| Party | Candidate | Vote % | Votes | |
| Republican | 66.1% | 156,501 | ||
| Democratic | Robert Reed Kelley | 31.5% | 74,479 | |
| Libertarian | Barry Maggert | 2.4% | 5,673 | |
| Total Votes | 236,653 | |||
1996
On November 5, 1996, Scott McInnis won re-election to the United States House. He defeated Albert Gurule (D) in the general election.[17]
| U.S. House, Colorado District 3 General Election, 1996 | ||||
|---|---|---|---|---|
| Party | Candidate | Vote % | Votes | |
| Republican | 68.9% | 183,523 | ||
| Democratic | Albert Gurule | 31.1% | 82,953 | |
| Total Votes | 266,476 | |||
1994
On November 8, 1994, Scott McInnis won re-election to the United States House. He defeated Linda Powers (D) in the general election.[18]
| U.S. House, Colorado District 3 General Election, 1994 | ||||
|---|---|---|---|---|
| Party | Candidate | Vote % | Votes | |
| Republican | 69.6% | 145,365 | ||
| Democratic | Linda Powers | 30.4% | 63,427 | |
| Total Votes | 208,792 | |||
1992
On November 3, 1992, Scott McInnis won election to the United States House. He defeated Mike Callihan (D) and Ki Nelson (Populist) in the general election.[19]
| U.S. House, Colorado District 3 General Election, 1992 | ||||
|---|---|---|---|---|
| Party | Candidate | Vote % | Votes | |
| Republican | 54.7% | 143,293 | ||
| Democratic | Mike Callihan | 43.7% | 114,480 | |
| Populist | Ki Nelson | 1.6% | 4,189 | |
| N/A | Write-in | 0% | 2 | |
| Total Votes | 261,964 | |||
1990
On November 6, 1990, Ben Nighthorse Campbell won re-election to the United States House. He defeated Bob Ellis (R) and Howard Fields (Colorado Populist) in the general election.[20]
| U.S. House, Colorado District 3 General Election, 1990 | ||||
|---|---|---|---|---|
| Party | Candidate | Vote % | Votes | |
| Democratic | 70.2% | 124,487 | ||
| Republican | Bob Ellis | 28.2% | 49,961 | |
| Colorado Populist | Howard Fields | 1.6% | 2,859 | |
| Total Votes | 177,307 | |||
Redistricting
2010-2011

- See also: Redistricting in Colorado
In 2011, the Colorado State Legislature re-drew the congressional districts based on updated population information from the 2010 census.
District analysis
- See also: The Cook Political Report's Partisan Voter Index
- See also: FiveThirtyEight's elasticity scores
The 2017 Cook Partisan Voter Index for this district was R+6, meaning that in the previous two presidential elections, this district's results were 6 percentage points more Republican than the national average. This made Colorado's 3rd Congressional District the 180th most Republican nationally.[21]
FiveThirtyEight's September 2018 elasticity score for states and congressional districts measured "how sensitive it is to changes in the national political environment." This district's elasticity score was 1.14. This means that for every 1 point the national political mood moved toward a party, the district was expected to move 1.14 points toward that party.[22]
See also
External links
Footnotes
- ↑ Demographic data were added to this page in 2013. Ballotpedia will update this page in 2021 after data from the 2020 Census become available.
- ↑ Note: Percentages for race and ethnicity may add up to more than 100 percent because respondents may report more than one race and the Hispanic/Latino ethnicity may be selected in conjunction with any race. Read more about race and ethnicity in the census here.
- ↑ United States Census Bureau, "Counties by Congressional Districts," accessed June 8, 2016
- ↑ The raw data for this study was provided by Dave Leip of Atlas of U.S. Presidential Elections.
- ↑ Gaylon Kent for Congress, "Home," accessed April 9, 2018
- ↑ Colorado Secretary of State, "2016 Primary Election Candidate List," accessed May 2, 2016
- ↑ Politico, "Colorado House Primaries Results," June 28, 2016
- ↑ Colorado Secretary of State, "2016 General Election Candidate List," accessed September 5, 2016
- ↑ Politico, "2012 Election Map, Colorado," November 6, 2012
- ↑ U.S. Congress House Clerk, "Statistics of the Congressional Election of November 2, 2010," accessed March 28, 2013
- ↑ U.S. Congress House Clerk, "Statistics of the Congressional Election of November 4, 2008," accessed March 28, 2013
- ↑ U.S. Congress House Clerk, "Statistics of the Congressional Election of November 7, 2006," accessed March 28, 2013
- ↑ U.S. Congress House Clerk, "Statistics of the Congressional Election of November 2, 2004," accessed March 28, 2013
- ↑ U.S. Congress House Clerk, "Statistics of the Congressional Election of November 5, 2002," accessed March 28, 2013
- ↑ U.S. Congress House Clerk, "Statistics of the Congressional Election of November 7, 2000," accessed March 28, 2013
- ↑ U.S. Congress House Clerk, "Statistics of the Congressional Election of November 3, 1998," accessed March 28, 2013
- ↑ U.S. Congress House Clerk, "Statistics of the Congressional Election of November 5, 1996," accessed March 28, 2013
- ↑ U.S. Congress House Clerk, "Statistics of the Congressional Election of November 8, 1994," accessed March 28, 2013
- ↑ U.S. Congress House Clerk, "Statistics of the Congressional Election of November 3, 1992," accessed March 28, 2013
- ↑ U.S. Congress House Clerk, "Statistics of the Congressional Election of November 6, 1990," accessed March 28, 2013
- ↑ Cook Political Report, "Introducing the 2017 Cook Political Report Partisan Voter Index," April 7, 2017
- ↑ FiveThirtyEight, "Election Update: The Most (And Least) Elastic States And Districts," September 6, 2018