Colorado's 6th Congressional District
| Colorado's 6th Congressional District |
|---|
 |
| Incumbent Jason Crow Cook Partisan Voter Index (2018): D+2 |
| U.S. Census Bureau (2010 data)[1] |
| Population: 744,526 |
| Gender: 51% Female, 49% Male |
| Race[2]: 77.3% White, 8.8% Black, 5.0% Asian |
| Ethnicity: 19.6% Hispanic |
| Unemployment: 9.2% |
| Median household income $63,513 |
| High school graduation rate 90.8% |
| College graduation rate 39.1% |
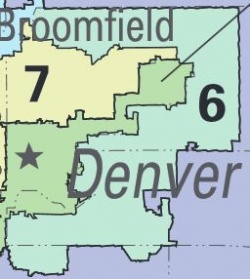
As of the 2010 redistricting cycle, Colorado's 6th Congressional District was one of five located in central Colorado. It included portions of Adams, Arapahoe, and Douglas counties.[3]
The current representative of the 6th Congressional District is Jason Crow (D).
Elections
2018
General election
General election candidates
- Mike Coffman (Incumbent) (Republican Party)
- Jason Crow (Democratic Party) ✔
- Kat Martin (Libertarian Party)
- Dan Chapin (Unaffiliated)
Write-in candidates
Primary candidates
| Click "Expand" to view a list of the primary candidates in this race. |
|
2016
Colorado's 6th Congressional District was a battleground district in 2016. Incumbent Mike Coffman (R) won re-election to his fifth term in 2016. He defeated former State Senate Minority Leader Morgan Carroll (D), Norm Olsen (L), and Robert Lee Worthey (G) in the general election on November 8, 2016. No candidate faced an opponent in the primary on June 28, 2016.[4][5][6][7]
| Party | Candidate | Vote % | Votes | |
|---|---|---|---|---|
| Republican | 50.9% | 191,626 | ||
| Democratic | Morgan Carroll | 42.6% | 160,372 | |
| Libertarian | Norm Olsen | 5% | 18,778 | |
| Green | Robert Lee Worthey | 1.5% | 5,641 | |
| Total Votes | 376,417 | |||
| Source: Colorado Secretary of State | ||||
2014

Colorado's 6th Congressional District was a battleground district in 2014 due to the fact that the seat was held by a Republican, but the district had a slight Democratic lean. In the primary, both incumbent Mike Coffman (R) and Andrew Romanoff (D) faced no challenger. Coffman defeated Romanoff, Libertarian Norm Olsen and Green Party candidate Gary Swing in the general election on November 4, 2014.[8][9]
| Party | Candidate | Vote % | Votes | |
|---|---|---|---|---|
| Republican | 51.9% | 143,467 | ||
| Democratic | Andrew Romanoff | 43% | 118,847 | |
| Libertarian | Norm Olsen | 3.1% | 8,623 | |
| Green | Gary Swing | 2% | 5,503 | |
| Total Votes | 276,440 | |||
| Source: Colorado Secretary of State | ||||
2012
The 6th Congressional District of Colorado held an election for the U.S. House of Representatives on November 6, 2012. Incumbent Mike Coffman (Colorado) won re-election in the district.[10]
| Party | Candidate | Vote % | Votes | |
|---|---|---|---|---|
| Democratic | Joe Miklosi | 45.8% | 156,930 | |
| Republican | 47.8% | 163,922 | ||
| Libertarian | Patrick Provost | 2.5% | 8,597 | |
| Independent | Kathy Polhemus | 3.9% | 13,442 | |
| Total Votes | 342,891 | |||
| Source: Colorado Secretary of State "Official Election Results, 2012 General Election" | ||||
2010
On November 2, 2010, Mike Coffman won re-election to the United States House. He defeated John Flerlage (D), Rob McNealy (L) and Michael Shawn Kearns (Write-in) in the general election.[11]
| U.S. House, Colorado District 6 General Election, 2010 | ||||
|---|---|---|---|---|
| Party | Candidate | Vote % | Votes | |
| Republican | 65.7% | 217,368 | ||
| Democratic | John Flerlage | 31.5% | 104,104 | |
| Libertarian | Rob McNealy | 2.9% | 9,466 | |
| Write-in | Michael Shawn Kearns | 0% | 5 | |
| Total Votes | 330,943 | |||
2008
On November 4, 2008, Mike Coffman won election to the United States House. He defeated Hank Eng (D) in the general election.[12]
| U.S. House, Colorado District 6 General Election, 2008 | ||||
|---|---|---|---|---|
| Party | Candidate | Vote % | Votes | |
| Republican | 60.7% | 250,877 | ||
| Democratic | Hank Eng | 39.3% | 162,639 | |
| Total Votes | 413,516 | |||
2006
On November 7, 2006, Thomas Tancredo won re-election to the United States House. He defeated Bill Winter (D), Jack Woehr (L) and Juan Botero (Write-in) in the general election.[13]
| U.S. House, Colorado District 6 General Election, 2006 | ||||
|---|---|---|---|---|
| Party | Candidate | Vote % | Votes | |
| Republican | 58.6% | 158,806 | ||
| Democratic | Bill Winter | 39.9% | 108,007 | |
| Libertarian | Jack Woehr | 1.5% | 4,093 | |
| Write-in | Juan Botero | 0% | 25 | |
| Total Votes | 270,931 | |||
2004
On November 2, 2004, Thomas Tancredo won re-election to the United States House. He defeated Joanna Conti (D), Jack Woehr (L) and Peter Shevchuk (American Constitution) in the general election.[14]
| U.S. House, Colorado District 6 General Election, 2004 | ||||
|---|---|---|---|---|
| Party | Candidate | Vote % | Votes | |
| Republican | 59.5% | 212,778 | ||
| Democratic | Joanna Conti | 39.1% | 139,870 | |
| Libertarian | Jack Woehr | 1.1% | 3,857 | |
| American Constitution | Peter Shevchuk | 0.3% | 1,236 | |
| Total Votes | 357,741 | |||
2002
On November 5, 2002, Thomas Tancredo won re-election to the United States House. He defeated Lance Wright (D) and Adam Katz (L) in the general election.[15]
| U.S. House, Colorado District 6 General Election, 2002 | ||||
|---|---|---|---|---|
| Party | Candidate | Vote % | Votes | |
| Republican | 66.9% | 158,851 | ||
| Democratic | Lance Wright | 30% | 71,327 | |
| Libertarian | Adam Katz | 3.1% | 7,323 | |
| Total Votes | 237,501 | |||
2000
On November 7, 2000, Thomas Tancredo won re-election to the United States House. He defeated Kenneth Toltz (D), Adam Katz (L) and John Heckman (Concerns of People) in the general election.[16]
| U.S. House, Colorado District 6 General Election, 2000 | ||||
|---|---|---|---|---|
| Party | Candidate | Vote % | Votes | |
| Republican | 53.9% | 141,410 | ||
| Democratic | Kenneth Toltz | 42.1% | 110,568 | |
| Libertarian | Adam Katz | 2.6% | 6,885 | |
| Concerns of People | John Heckman | 1.4% | 3,614 | |
| Total Votes | 262,477 | |||
1998
On November 3, 1998, Thomas Tancredo won election to the United States House. He defeated Henry Strauss (D) and George Newman (Natural Law) in the general election.[17]
| U.S. House, Colorado District 6 General Election, 1998 | ||||
|---|---|---|---|---|
| Party | Candidate | Vote % | Votes | |
| Republican | 55.9% | 111,374 | ||
| Democratic | Henry Strauss | 41.5% | 82,662 | |
| Natural Law | George Newman | 2.6% | 5,152 | |
| Total Votes | 199,188 | |||
1996
On November 5, 1996, Dan Schaefer won re-election to the United States House. He defeated Joan Fitz-Gerald (D) in the general election.[18]
| U.S. House, Colorado District 6 General Election, 1996 | ||||
|---|---|---|---|---|
| Party | Candidate | Vote % | Votes | |
| Republican | 62.2% | 146,018 | ||
| Democratic | Joan Fitz-Gerald | 37.8% | 88,600 | |
| Total Votes | 234,618 | |||
1994
On November 8, 1994, Dan Schaefer won re-election to the United States House. He defeated John Hallen (D), John Heckman (Concerns of People) and Stephen Dawson (Natural Law) in the general election.[19]
| U.S. House, Colorado District 6 General Election, 1994 | ||||
|---|---|---|---|---|
| Party | Candidate | Vote % | Votes | |
| Republican | 69.8% | 124,079 | ||
| Democratic | John Hallen | 28% | 49,701 | |
| Concerns of People | John Heckman | 1.4% | 2,536 | |
| Natural Law | Stephen Dawson | 0.8% | 1,393 | |
| Total Votes | 177,709 | |||
1992
On November 3, 1992, Dan Schaefer won re-election to the United States House. He defeated Tom Kolbe (D) and Earl Higgerson (I) in the general election.[20]
| U.S. House, Colorado District 6 General Election, 1992 | ||||
|---|---|---|---|---|
| Party | Candidate | Vote % | Votes | |
| Republican | 60.9% | 142,021 | ||
| Democratic | Tom Kolbe | 39.1% | 91,073 | |
| Independent | Earl Higgerson | 0% | 3 | |
| Total Votes | 233,097 | |||
1990
On November 6, 1990, Dan Schaefer won re-election to the United States House. He defeated Don Jarrett (D) in the general election.[21]
| U.S. House, Colorado District 6 General Election, 1990 | ||||
|---|---|---|---|---|
| Party | Candidate | Vote % | Votes | |
| Republican | 64.5% | 105,312 | ||
| Democratic | Don Jarrett | 35.5% | 57,961 | |
| Total Votes | 163,273 | |||
Redistricting
2010-2011

- See also: Redistricting in Colorado
In 2011, the Colorado State Legislature re-drew the congressional districts based on updated population information from the 2010 census.
District analysis
- See also: The Cook Political Report's Partisan Voter Index
- See also: FiveThirtyEight's elasticity scores
The 2017 Cook Partisan Voter Index for this district was D+2, meaning that in the previous two presidential elections, this district's results were 2 percentage points more Democratic than the national average. This made Colorado's 6th Congressional District the 183rd most Democratic nationally.[22]
FiveThirtyEight's September 2018 elasticity score for states and congressional districts measured "how sensitive it is to changes in the national political environment." This district's elasticity score was 1.03. This means that for every 1 point the national political mood moved toward a party, the district was expected to move 1.03 points toward that party.[23]
See also
External links
Footnotes
- ↑ Demographic data were added to this page in 2013. Ballotpedia will update this page in 2021 after data from the 2020 Census become available.
- ↑ Note: Percentages for race and ethnicity may add up to more than 100 percent because respondents may report more than one race and the Hispanic/Latino ethnicity may be selected in conjunction with any race. Read more about race and ethnicity in the census here.
- ↑ United States Census Bureau, "Counties by Congressional Districts," accessed June 8, 2016
- ↑ Aurora Sentinel, "State Sen. Morgan Carroll makes official her battle against Mike Coffman for Aurora’s congressional seat," July 7, 2015
- ↑ Colorado Secretary of State, "2016 Primary Election Candidate List," accessed May 2, 2016
- ↑ Politico, "Colorado House Primaries Results," June 28, 2016
- ↑ Colorado Secretary of State, "2016 General Election Candidate List," accessed September 5, 2016
- ↑ Colorado Secretary of State, "Primary election results," accessed June 24, 2014
- ↑ The Huffington Post, "Election 2014," November 4, 2014
- ↑ Politico, "2012 Election Map, Colorado," November 6, 2012
- ↑ U.S. Congress House Clerk, "Statistics of the Congressional Election of November 2, 2010," accessed March 28, 2013
- ↑ U.S. Congress House Clerk, "Statistics of the Congressional Election of November 4, 2008," accessed March 28, 2013
- ↑ U.S. Congress House Clerk, "Statistics of the Congressional Election of November 7, 2006," accessed March 28, 2013
- ↑ U.S. Congress House Clerk, "Statistics of the Congressional Election of November 2, 2004," accessed March 28, 2013
- ↑ U.S. Congress House Clerk, "Statistics of the Congressional Election of November 5, 2002," accessed March 28, 2013
- ↑ U.S. Congress House Clerk, "Statistics of the Congressional Election of November 7, 2000," accessed March 28, 2013
- ↑ U.S. Congress House Clerk, "Statistics of the Congressional Election of November 3, 1998," accessed March 28, 2013
- ↑ U.S. Congress House Clerk, "Statistics of the Congressional Election of November 5, 1996," accessed March 28, 2013
- ↑ U.S. Congress House Clerk, "Statistics of the Congressional Election of November 8, 1994," accessed March 28, 2013
- ↑ U.S. Congress House Clerk, "Statistics of the Congressional Election of November 3, 1992," accessed March 28, 2013
- ↑ U.S. Congress House Clerk, "Statistics of the Congressional Election of November 6, 1990," accessed March 28, 2013
- ↑ Cook Political Report, "Introducing the 2017 Cook Political Report Partisan Voter Index," April 7, 2017
- ↑ FiveThirtyEight, "Election Update: The Most (And Least) Elastic States And Districts," September 6, 2018