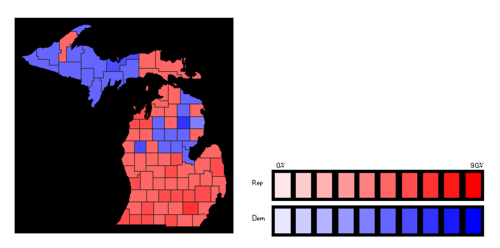
Michigan gubernatorial elections, 1956-2010
The following is a list of gubernatorial elections held in the state of Michigan from 1956 to 2010.
1956-1964
During this time, gubernatorial elections were held every two years.
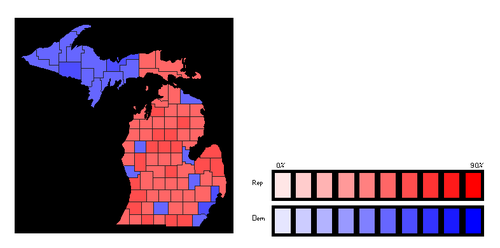
1956
On November 6, 1956, G. Mennen Williams won re-election to the office of Governor of Michigan. He defeated Albert E. Cobo in the general election.
| Governor of Michigan, 1956 | ||||
|---|---|---|---|---|
| Party | Candidate | Vote % | Votes | |
| Democratic | 54.7% | 1,666,689 | ||
| Republican | Albert E. Cobo | 45.1% | 1,376,376 | |
| Prohibition | Alfred T. Halstead | 0.2% | 6,538 | |
| Other | Write-ins | 0% | 48 | |
| Total Votes | 3,049,651 | |||
| Election results via David Leip, "Dave Leip's Atlas of U.S. Presidential Elections," accessed February 14, 2014. | ||||
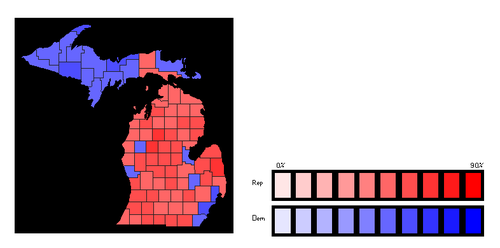
1958
On November 4, 1958, G. Mennen Williams won re-election to the office of Governor of Michigan. He defeated Paul D. Bagwell in the general election.
| Governor of Michigan, 1958 | ||||
|---|---|---|---|---|
| Party | Candidate | Vote % | Votes | |
| Democratic | 53% | 1,225,533 | ||
| Republican | Paul D. Bagwell | 46.6% | 1,078,089 | |
| Socialist Labor | Ralph W. Muncy | 0.2% | 3,983 | |
| Prohibition | Rollin M. Severance | 0.2% | 3,622 | |
| Socialist Workers | Frank Lovell | 0% | 957 | |
| Total Votes | 2,312,184 | |||
| Election results via David Leip, "Dave Leip's Atlas of U.S. Presidential Elections," accessed February 14, 2014. | ||||
1960
On November 8, 1960, John B. Swainson won election to the office of Governor of Michigan. He defeated Paul D. Bagwell in the general election.
| Governor of Michigan, 1960 | ||||
|---|---|---|---|---|
| Party | Candidate | Vote % | Votes | |
| Democratic | 50.5% | 1,643,634 | ||
| Republican | Paul D. Bagwell | 49.2% | 1,602,022 | |
| Socialist Workers | Robert Himmel, Jr. | 0.1% | 3,387 | |
| Prohibition | Delmar D. Gibbons | 0.1% | 2,183 | |
| Tax Cut | F. J. Toohey | 0.1% | 1,899 | |
| Socialist Labor | Theos A. Grove | 0% | 1,479 | |
| Independent American | R. Roy Pursell | 0% | 1,354 | |
| Other | Write-ins | 0% | 33 | |
| Total Votes | 3,255,991 | |||
| Election results via David Leip, "Dave Leip's Atlas of U.S. Presidential Elections," accessed February 14, 2014. | ||||
1962
On November 6, 1962, George Romney won re-election to the office of Governor of Michigan. He defeated John B. Swainson in the general election.
| Governor of Michigan, 1962 | ||||
|---|---|---|---|---|
| Party | Candidate | Vote % | Votes | |
| Republican | 51.4% | 1,420,086 | ||
| Democratic | John B. Swainson Incumbent | 48.4% | 1,339,513 | |
| Socialist Labor | James Sim | 0.2% | 5,219 | |
| Other | Write-ins | 0% | 21 | |
| Total Votes | 2,764,839 | |||
| Election results via David Leip, "Dave Leip's Atlas of U.S. Presidential Elections," accessed February 14, 2014. | ||||
1964
On November 3, 1964, George Romney won re-election to the office of Governor of Michigan. He defeated Neil Staebler in the general election.
| Governor of Michigan, 1964 | ||||
|---|---|---|---|---|
| Party | Candidate | Vote % | Votes | |
| Republican | 55.9% | 1,764,355 | ||
| Democratic | Neil Staebler | 43.7% | 1,381,442 | |
| Socialist Workers | Frank Lovell | 0.2% | 5,649 | |
| Freedom Now | Albert B. Cleage, Jr. | 0.2% | 4,767 | |
| Socialist Labor | James Horvath | 0.1% | 1,777 | |
| Other | Write-ins | 0% | 112 | |
| Total Votes | 3,158,102 | |||
| Election results via David Leip, "Dave Leip's Atlas of U.S. Presidential Elections," accessed February 14, 2014. | ||||
1966-2010
Starting with the 1966 election, gubernatorial elections began being held every four years.
1966
On November 8, 1966, George Romney won re-election to the office of Governor of Michigan. He defeated Zolton Ferency in the general election.
| Governor of Michigan, 1966 | ||||
|---|---|---|---|---|
| Party | Candidate | Vote % | Votes | |
| Republican | 60.5% | 1,490,430 | ||
| Democratic | Zolton Ferency | 39.1% | 963,383 | |
| Socialist Labor | James Horvath | 0.3% | 8,017 | |
| Other | Write-ins | 0% | 79 | |
| Total Votes | 2,461,909 | |||
| Election results via David Leip, "Dave Leip's Atlas of U.S. Presidential Elections," accessed February 14, 2014. | ||||
1970
On January 22, 1969, Governor George Romney resigned to become Secretary of Housing and Urban Development under President Richard Nixon; Lieutenant Governor William G. Milliken was sworn in as his successor. On November 3, 1970, William G. Milliken won re-election to the office of Governor of Michigan. He defeated Sander Levin in the general election.
| Governor of Michigan, 1970 | ||||
|---|---|---|---|---|
| Party | Candidate | Vote % | Votes | |
| Republican | 50.4% | 1,339,047 | ||
| Democratic | Sander Levin | 48.7% | 1,294,638 | |
| American Independent | James L. McCormick | 0.7% | 18,006 | |
| Socialist Workers | George Bouse | 0.1% | 2,220 | |
| Socialist Labor | James Horvath | 0.1% | 2,144 | |
| Other | Write-ins | 0% | 107 | |
| Total Votes | 2,656,162 | |||
| Election results via David Leip, "Dave Leip's Atlas of U.S. Presidential Elections," accessed February 14, 2014. | ||||
1974
On November 5, 1974, William G. Milliken won re-election to the office of Governor of Michigan. He defeated Sander Levin in the general election.
| Governor of Michigan, 1974 | ||||
|---|---|---|---|---|
| Party | Candidate | Vote % | Votes | |
| Republican | 51.1% | 1,356,865 | ||
| Democratic | Sander Levin | 46.8% | 1,242,247 | |
| Human Rights | Zolton Ferency | 1.1% | 28,675 | |
| American Independent | Hugh McDermand Davidson | 0.8% | 20,278 | |
| Conservative | Eldon K. Andrews | 0.2% | 4,117 | |
| Socialist Workers | Robin Maisel | 0.1% | 1,505 | |
| Socialist Labor | James Horvath | 0% | 1,296 | |
| Communist | Thomas D. Dennis | 0% | 1,119 | |
| United States Labor | Peter A. Signorelli | 0% | 898 | |
| Other | Write-ins | 0% | 17 | |
| Total Votes | 2,657,017 | |||
| Election results via http://uselectionatlas.org/RESULTS/ David Leip, "Dave Leip's Atlas of U.S. Presidential Elections," accessed February 14, 2014]. | ||||
1978
On November 7, 1978, William G. Milliken won re-election to the office of Governor of Michigan. He defeated William B. Fitzgerald in the general election.
| Governor of Michigan, 1978 | ||||
|---|---|---|---|---|
| Party | Candidate | Vote % | Votes | |
| Republican | 56.8% | 1,628,485 | ||
| Democratic | William B. Fitzgerald | 43.2% | 1,237,256 | |
| Other | Write-ins | 0.1% | 1,471 | |
| Total Votes | 2,867,212 | |||
| Election results via http://uselectionatlas.org/RESULTS/ David Leip, "Dave Leip's Atlas of U.S. Presidential Elections," accessed February 14, 2014]. | ||||
1982
On November 2, 1982, James Blanchard won election to the office of Governor of Michigan. He defeated Richard H. Headlee in the general election.
| Governor of Michigan, 1982 | ||||
|---|---|---|---|---|
| Party | Candidate | Vote % | Votes | |
| Democratic | 51.4% | 1,561,291 | ||
| Republican | Richard H. Headlee | 45.1% | 1,369,582 | |
| Tisch Independent Citizens | Robert F. Tisch | 2.6% | 80,288 | |
| Libertarian | Dick Jacobs | 0.5% | 15,603 | |
| American Independent | James O. Phillips | 0.2% | 7,356 | |
| Socialist Workers | Tim Craine | 0.1% | 3,682 | |
| Workers' League | Martin P. McLaughlin | 0.1% | 1,980 | |
| Other | Write-ins | 0% | 226 | |
| Total Votes | 3,040,008 | |||
| Election results via David Leip, "Dave Leip's Atlas of U.S. Presidential Elections," accessed February 14, 2014. | ||||
1986
On November 4, 1986, James Blanchard won re-election to the office of Governor of Michigan. He defeated William Lucas in the general election.
| Governor of Michigan, 1986 | ||||
|---|---|---|---|---|
| Party | Candidate | Vote % | Votes | |
| Democratic | 68.1% | 1,632,138 | ||
| Republican | William Lucas | 31.4% | 753,647 | |
| Workers' League | Martin P. McLaughlin | 0.4% | 9,477 | |
| Other | Write-ins | 0.1% | 1,302 | |
| Total Votes | 2,396,564 | |||
| Election results via David Leip, "Dave Leip's Atlas of U.S. Presidential Elections," accessed February 14, 2014. | ||||
1990
On November 6, 1990, John Engler won re-election to the office of Governor of Michigan. He defeated James Blanchard in the general election.
| Governor of Michigan, 1990 | ||||
|---|---|---|---|---|
| Party | Candidate | Vote % | Votes | |
| Republican | 49.8% | 1,276,134 | ||
| Democratic | James Blanchard Incumbent | 49.1% | 1,258,539 | |
| Workers' World | William Roundtree | 1.1% | 28,091 | |
| Other | Write-ins | 0.1% | 1,799 | |
| Total Votes | 2,564,563 | |||
| Election results via David Leip, "Dave Leip's Atlas of U.S. Presidential Elections," accessed February 14, 2014. | ||||
1994
On November 8, 1994, John Engler won re-election to the office of Governor of Michigan. He defeated Howard E. Wolpe in the general election.
| Governor of Michigan, 1994 | ||||
|---|---|---|---|---|
| Party | Candidate | Vote % | Votes | |
| Republican | 61.5% | 1,899,101 | ||
| Democratic | Howard E. Wolpe | 38.5% | 1,188,438 | |
| Other | Write-ins | 0% | 1,538 | |
| Total Votes | 3,089,077 | |||
| Election results via David Leip, "Dave Leip's Atlas of U.S. Presidential Elections," accessed February 14, 2014. | ||||
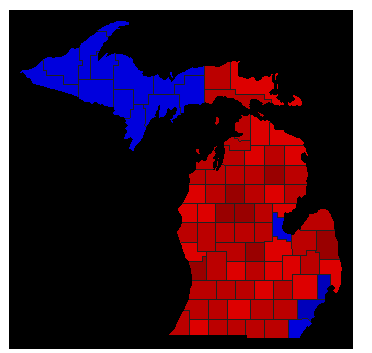
1998
On November 3, 1998, John Engler won re-election to the office of Governor of Michigan. He defeated Geoffrey Fieger in the general election.
| Governor of Michigan, 1998 | ||||
|---|---|---|---|---|
| Party | Candidate | Vote % | Votes | |
| Republican | 62.2% | 1,883,005 | ||
| Democratic | Geoffrey Fieger | 37.8% | 1,143,574 | |
| Other | Write-ins | 0% | 525 | |
| Total Votes | 3,027,104 | |||
| Election results via Michigan Department of State, "1998 Official Michigan General Election Results - Governor 4 Year Term (1) Position," February 9, 1999," accessed February 14, 2014. | ||||
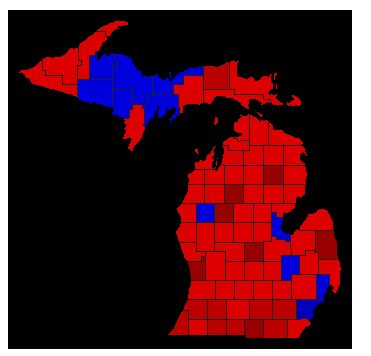
2002
On November 5, 2002, Jennifer Granholm won election to the office of Governor of Michigan. She defeated Dick Posthumus in the general election.
| Governor of Michigan, 2002 | ||||
|---|---|---|---|---|
| Party | Candidate | Vote % | Votes | |
| Democratic | 51.4% | 1,633,796 | ||
| Republican | Dick Posthumus | 47.4% | 1,506,104 | |
| Libertarian | Douglas Campbell | 0.8% | 25,236 | |
| Taxpayers | Joseph Pilchak | 0.4% | 12,411 | |
| Other | Write-ins | 0% | 18 | |
| Total Votes | 3,177,565 | |||
| Election results via Michigan Department of State, "2002 Official Michigan General Election Results - Governor 4 Year Term (1) Position," December 17, 2002," accessed February 14, 2014. | ||||
2006
On November 7, 2006, Jennifer Granholm won re-election to the office of Governor of Michigan. She defeated Dick DeVos in the general election.
| Governor of Michigan, 2006 | ||||
|---|---|---|---|---|
| Party | Candidate | Vote % | Votes | |
| Democratic | 56.4% | 2,142,513 | ||
| Republican | Dick DeVos | 42.3% | 1,608,086 | |
| Libertarian | Gregory Creswell | 0.6% | 23,524 | |
| Green | Douglas Campbell | 0.5% | 20,009 | |
| Taxpayers | Bhagwan Dashairya | 0.2% | 7,087 | |
| Other | Write-ins | 0% | 37 | |
| Total Votes | 3,801,256 | |||
| Election results via Michigan Department of State, "2006 Official Michigan General Election Results - Governor 4 Year Term (1) Position," May 10, 2007," accessed February 14, 2014. | ||||
2010
On November 2, 2010, Rick Snyder won election to the office of Governor of Michigan. He defeated Virg Bernero in the general election.
| Governor of Michigan, 2010 | ||||
|---|---|---|---|---|
| Party | Candidate | Vote % | Votes | |
| Republican | 58.1% | 1,874,834 | ||
| Democratic | Virg Bernero | 39.9% | 1,287,320 | |
| Libertarian | Ken Proctor | 0.7% | 22,390 | |
| Taxpayers | Stacey Mathia | 0.6% | 20,818 | |
| Green | Harvey Mikkelson | 0.6% | 20,699 | |
| Other | Write-ins | 0% | 27 | |
| Total Votes | 3,226,088 | |||
| Election results via Michigan Department of State, "2010 Official Michigan General Election Results - Governor 4 Year Term (1) Position," March 2, 2011," accessed February 14, 2014. | ||||
Footnotes


