Wisconsin state executive official elections, 2014
2015 →
← 2013
|
| 2014 State Executive Official Elections |
| Alabama • Alaska • Arizona • Arkansas • California • Colorado • Connecticut • Delaware • Florida • Georgia • Hawaii • Idaho • Illinois • Indiana • Iowa • Kansas • Louisiana • Maine • Maryland • Massachusetts • Michigan • Minnesota • Missouri • Montana • Nebraska • Nevada • New Hampshire • New Mexico • New York • North Dakota • Ohio • Oklahoma • Oregon • Pennsylvania • Rhode Island • South Carolina • South Dakota • Tennessee • Texas • Utah • Vermont • Wisconsin • Wyoming |
| Partisan breakdown Candidates by office Voter turnout Key deadlines State executive organization Ballotpedia reports Recent news See also |
| News • Calendar |
Five state executive positions were up for election in 2014 in the state of Wisconsin. The general election took place on November 4, 2014.
In addition to candidate lists and election results, this page includes information about important dates, how the state's executive branch is organized, as well as links to articles about recent news in races across the state.
A primary election is an election in which registered voters select a candidate that they believe should be a political party's candidate for elected office to run in the general election. They are also used to choose convention delegates and party leaders. Primaries are state-level and local-level elections that take place prior to a general election. Wisconsin utilizes an open primary system; registered voters do not have to be members of a party to vote in that party's primary.[1]
For information about which offices are nominated via primary election, see this article.
The following offices were elected in 2014 in Wisconsin:
- Governor of Wisconsin
- Lieutenant Governor of Wisconsin
- Wisconsin Attorney General
- Wisconsin Secretary of State
- Wisconsin Treasurer
Partisan breakdown
Heading into the November 4 election, the Republican Party held four of the five state executive seats in Wisconsin.
| Wisconsin State Executives -- Partisan Breakdown | |||
|---|---|---|---|
| Party | As of November 4, 2014 | After the 2014 Election | |
| Republican Party | 4 | 4 | |
| Democratic Party | 1 | 1 | |
| Total | 5 | 5 | |
Candidates by office
| Office | Incumbent | Assumed Office | Incumbent running? | General Election Candidates | 2015 Winner | Partisan Switch? |
| Governor | Scott Walker  |
2011 | Yes[2] | No | ||
| Lieutenant Governor | Rebecca Kleefisch  |
2011 | Yes[2] | No | ||
| Secretary of State | Douglas La Follette  |
1983 | Yes[3] | No | ||
| Attorney General | J.B. Van Hollen  |
2007 | Did not run[4] | No | ||
| Treasurer | Kurt Schuller  |
2011 | Not running | No |
Primary election results
Governor
| Wisconsin Gubernatorial Democratic Primary, 2014 | ||||
|---|---|---|---|---|
| Candidate | Vote % | Votes | ||
| 83.4% | 259,926 | |||
| Brett Hulsey | 16.6% | 51,830 | ||
| Total Votes | 311,756 | |||
| Election results via Wisconsin Government Accountability Board. | ||||
Incumbent Republican Scott Walker was opposed only by a write-in candidate and news outlets did not report the result.
Lieutenant Governor
| Wisconsin Lieutenant Gubernatorial Democratic Primary, 2014 | ||||
|---|---|---|---|---|
| Candidate | Vote % | Votes | ||
| 55.2% | 144,591 | |||
| Mary Jo Walters | 44.5% | 116,518 | ||
| Write-in votes | 0.2% | 631 | ||
| Total Votes | 261,740 | |||
| Election results via Wisconsin Government Accountability Board. | ||||
Incumbent Republican Rebecca Kleefisch won re-nomination without opposition.
Attorney General
| Wisconsin Attorney General Democratic Primary, 2014 | ||||
|---|---|---|---|---|
| Candidate | Vote % | Votes | ||
| 52.1% | 144,727 | |||
| Jon Richards | 32.5% | 90,215 | ||
| Ismael Ozanne | 15.4% | 42,627 | ||
| Total Votes | 277,569 | |||
| Election results via Wisconsin Government Accountability Board. | ||||
Brad Schimel won the Republican nomination without opposition.
Secretary of State
| Wisconsin Secretary of State Republican Primary, 2014 | ||||
|---|---|---|---|---|
| Candidate | Vote % | Votes | ||
| 64.8% | 138,569 | |||
| Garey Bies | 35.2% | 75,379 | ||
| Total Votes | 213,948 | |||
| Election results via Wisconsin Government Accountability Board. | ||||
Incumbent Democrat Doug La Follette won re-nomination without opposition.
Treasurer
| Wisconsin Treasurer Democratic Primary, 2014 | ||||
|---|---|---|---|---|
| Candidate | Vote % | Votes | ||
| 51.5% | 119,756 | |||
| David Leeper | 48.5% | 112,584 | ||
| Total Votes | 232,340 | |||
| Election results via Wisconsin Government Accountability Board. | ||||
| Wisconsin Treasurer Republican Primary, 2014 | ||||
|---|---|---|---|---|
| Candidate | Vote % | Votes | ||
| 61.8% | 132,598 | |||
| Randall Melchert | 38.2% | 82,117 | ||
| Total Votes | 214,715 | |||
| Election results via Wisconsin Government Accountability Board. | ||||
General election results
The general election took place on November 4, 2014.
Governor and Lieutenant Governor
| Governor and Lieutenant Governor of Wisconsin, 2014 | ||||
|---|---|---|---|---|
| Party | Candidate | Vote % | Votes | |
| Republican | 52.3% | 1,259,706 | ||
| Democrat | Mary Burke/John Lehman | 46.6% | 1,122,913 | |
| Libertarian | Robert Burke/Joseph Brost | 0.8% | 18,720 | |
| Independent | Dennis Fehr | 0.3% | 7,530 | |
| Nonpartisan | Scattering | 0.1% | 1,248 | |
| Nonpartisan | Write-in votes | 0% | 200 | |
| Total Votes | 2,410,317 | |||
| Election results via Wisconsin Government Accountability Board | ||||
Attorney General
| Attorney General of Wisconsin, 2014 | ||||
|---|---|---|---|---|
| Party | Candidate | Vote % | Votes | |
| Republican | 51.5% | 1,211,388 | ||
| Democratic | Susan Happ | 45.4% | 1,066,866 | |
| Libertarian | Thomas Nelson | 3% | 70,951 | |
| Nonpartisan | Scattering | 0% | 1,120 | |
| Total Votes | 2,350,325 | |||
| Election results via Wisconsin Government Accountability Board | ||||
Secretary of State
| Secretary of State of Wisconsin, 2014 | ||||
|---|---|---|---|---|
| Party | Candidate | Vote % | Votes | |
| Democratic | 50% | 1,161,113 | ||
| Republican | Julian Bradley | 46.3% | 1,074,835 | |
| Libertarian | Andy Craig | 2.5% | 58,996 | |
| Constitution | Jerry Broitzman | 1.1% | 25,744 | |
| Nonpartisan | Scattering | 0.1% | 1,347 | |
| Total Votes | 2,322,035 | |||
| Election results via Wisconsin Government Accountability Board | ||||
Treasurer
| Wisconsin Treasurer, 2014 | ||||
|---|---|---|---|---|
| Party | Candidate | Vote % | Votes | |
| Republican | 48.8% | 1,120,140 | ||
| Democratic | David Sartori | 44.7% | 1,026,548 | |
| Green | Ron Hardy | 2.9% | 66,120 | |
| Libertarian | Jerry Shidell | 2.3% | 53,113 | |
| Constitution | Andrew Zuelke | 1.2% | 28,053 | |
| Nonpartisan | Scattering | 0.1% | 1,244 | |
| Total Votes | 2,295,218 | |||
| Election results via Wisconsin Government Accountability Board | ||||
Voter turnout
Political scientist Michael McDonald's United States Elections Project studied voter turnout in the 2014 election by looking at the percentage of eligible voters who headed to the polls. McDonald used voting-eligible population (VEP), or the number of eligible voters independent of their current registration status, to calculate turnout rates in each state on November 4. He also incorporated ballots cast for the highest office in each state into his calculation. He estimated that 81,687,059 ballots were cast in the 50 states plus the District of Columbia, representing 35.9 percent of the VEP.[5] By comparison, 61.6 percent of VEP voted in the 2008 presidential election and 58.2 percent of VEP voted in the 2012 presidential election.[6]
Quick facts
- According to PBS Newshour, voter turnout in the 2014 midterms was the lowest since the 1942 midterms, which took place during the nation's involvement in World War II.[7]
- Forty-three states and the District of Columbia did not surpass 50 percent turnout in McDonald's analysis.
- The three states with the lowest turnout according to McDonald's analysis were Texas (28.3 percent), Tennessee (28.6 percent), and Indiana (28.8 percent).
- Maine (58.5 percent), Wisconsin (56.5 percent), and Colorado (54.5 percent) were the three states with the highest turnout.
- Twelve states increased voter turnout in 2014 compared to the 2010 midterm elections.[8]
| Voter turnout rates, 2014 | |||||
|---|---|---|---|---|---|
| State | Total votes counted | % voter eligible population | Top statewide office up for election | Size of lead (Raw votes) | Size of lead (%) |
| Alabama | 1,191,274 | 33.2 | Governor | 320,319 | 27.2 |
| Alaska | 285,431 | 54.4 | Governor | 4,004 | 1.6 |
| Arizona | 1,537,671 | 34.1 | Governor | 143,951 | 12.5 |
| Arkansas | 852,642 | 40.1 | Governor | 118,664 | 14.0 |
| California | 7,513,972 | 30.8 | Governor | 1,065,748 | 17.8 |
| Colorado | 2,080,071 | 54.5 | Governor | 50,395 | 2.4 |
| Connecticut | 1,096,509 | 42.5 | Governor | 26,603 | 2.5 |
| Delaware | 234,038 | 34.4 | Attorney General | 31,155 | 13.6 |
| District of Columbia | 177,176 | 35.8 | Mayor | 27,934 | 19.0 |
| Florida | 6,026,802 | 43.3 | Governor | 66,127 | 1.1 |
| Georgia | 2,596,947 | 38.5 | Governor | 202,685 | 8.0 |
| Hawaii | 369,554 | 36.5 | Governor | 45,323 | 12.4 |
| Idaho | 445,307 | 39.6 | Governor | 65,852 | 14.9 |
| Illinois | 3,680,417 | 40.9 | Governor | 171,900 | 4.9 |
| Indiana | 1,387,622 | 28.8 | Secretary of State | 234,978 | 17.8 |
| Iowa | 1,142,284 | 50.2 | Governor | 245,548 | 21.8 |
| Kansas | 887,023 | 43.4 | Governor | 33,052 | 3.9 |
| Kentucky | 1,435,868 | 44.0 | U.S. Senate | 222,096 | 15.5 |
| Louisiana | 1,472,039 | 43.8 | U.S. Senate | 16,401 | 1.1 |
| Maine | 616,996 | 58.5 | Governor | 29,820 | 4.9 |
| Maryland | 1,733,177 | 41.5 | Governor | 88,648 | 6.1 |
| Massachusetts | 2,186,789 | 44.6 | Governor | 40,361 | 1.9 |
| Michigan | 3,188,956 | 43.2 | Governor | 129,547 | 4.3 |
| Minnesota | 1,992,613 | 50.5 | Governor | 109,776 | 5.6 |
| Mississippi | 631,858 | 28.9 | U.S. Senate | 141,234 | 33.0 |
| Missouri | 1,426,303 | 31.8 | Auditor | 684,074 | 53.6 |
| Montana | 373,831 | 47.3 | U.S. Senate | 65,262 | 17.9 |
| Nebraska | 552,115 | 41.5 | Governor | 97,678 | 18.7 |
| Nevada | 547,349 | 29.0 | Governor | 255,793 | 46.7 |
| New Hampshire | 495,565 | 48.4 | Governor | 24,924 | 5.2 |
| New Jersey | 1,955,042 | 32.5 | N/A | N/A | N/A |
| New Mexico | 512,805 | 35.7 | Governor | 73,868 | 14.6 |
| New York | 3,930,310 | 29.0 | Governor | 476,252 | 13.4 |
| North Carolina | 2,939,767 | 41.2 | U.S. Senate | 48,511 | 1.7 |
| North Dakota | 255,128 | 45.0 | U.S. House At-large seat | 42,214 | 17.1 |
| Ohio | 3,149,876 | 36.2 | Governor | 933,235 | 30.9 |
| Oklahoma | 824,831 | 29.8 | Governor | 122,060 | 14.7 |
| Oregon | 1,541,782 | 53.5 | Governor | 59,029 | 4.5 |
| Pennsylvania | 3,495,866 | 36.0 | Governor | 339,261 | 9.8 |
| Rhode Island | 329,212 | 42.2 | Governor | 14,346 | 4.5 |
| South Carolina | 1,261,611 | 35.2 | Governor | 179,089 | 14.6 |
| South Dakota | 282,291 | 44.9 | Governor | 124,865 | 45.1 |
| Tennessee | 1,374,065 | 28.6 | Governor | 642,214 | 47.5 |
| Texas | 4,727,208 | 28.3 | Governor | 957,973 | 20.4 |
| Utah | 577,973 | 30.2 | Attorney General | 173,819 | 35.2 |
| Vermont | 193,087 | 38.8 | Governor | 2,095 | 1.1 |
| Virginia | 2,194,346 | 36.6 | U.S. Senate | 16,727 | 0.8 |
| Washington | 2,123,901 | 43.1 | N/A | N/A | N/A |
| West Virginia | 451,498 | 31.2 | U.S. Senate | 124,667 | 27.6 |
| Wisconsin | 2,410,314 | 56.5 | Governor | 137,607 | 5.7 |
| Wyoming | 168,390 | 39.3 | Governor | 52,703 | 33.6 |
Note: Information from the United States Elections Project was last updated on December 16, 2014.
Key deadlines
| Deadline | Event |
|---|---|
| June 2, 2014 | Filing deadline |
| August 12, 2014 | Primary election |
| November 4, 2014 | General election |
| December 1, 2014 | Certification of results |
| January 5, 2015 | State executives inaugurated |
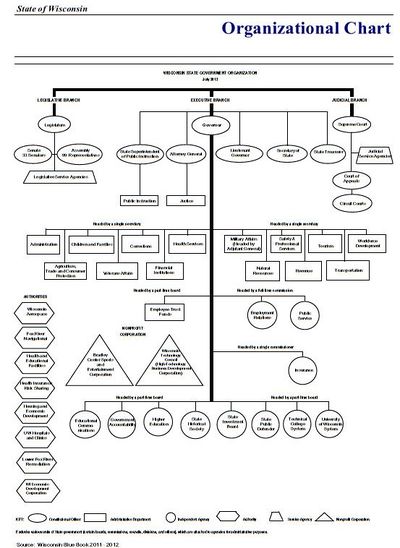
State executive organization
Executive officials in Wisconsin are part of a three-pronged government structure that includes state legislators and state judges. For a higher resolution version of this organizational chart, please see page 12 of the Wisconsin Comprehensive Annual Financial Report for FY 2012.
Ballotpedia reports
To learn more about developments in these races, check out the following news articles from Ballotpedia:
Recent news
This section links to a Google news search for the term "Wisconsin + state + executive + elections"
See also

Footnotes
- ↑ Wisconsin State Legislature, "Wis. Stat. § 5.62," accessed September 16, 2025
- ↑ 2.0 2.1 Wisconsin Government Accountability Board, "Nomination Paper Tracking with Supplemental Signature Report," accessed August 5, 2014
- ↑ Wisconsin Government Accountability Board, "Nomination Paper Tracking with Supplemental Signature Report," accessed May 30, 2014 (dead link)
- ↑ The Star, "UPDATED: Van Hollen won't run again in 2014," October 7, 2013
- ↑ United States Elections Project, "2014 November General Election Turnout Rates," November 7, 2014
- ↑ TIME, "Voter Turnout in Midterm Elections Hits 72-Year Low," November 10, 2014
- ↑ PBS, "2014 midterm election turnout lowest in 70 years," November 10, 2014
- ↑ U.S. News & World Report, "Midterm Turnout Down in 2014," November 5, 2014
