California's 30th Congressional District elections, 2012
2014 →
|
November 6, 2012 |
June 5, 2012 |
Brad Sherman |
Henry Waxman |
The 30th Congressional District of California held an election for the U.S. House of Representatives on November 6, 2012.
Former 27th District incumbent Brad Sherman (D) won the election.[1]
| Candidate Filing Deadline | Primary Election | General Election |
|---|---|---|
Primary: California has a top-two primary system, in which the top two vote-getters, regardless of party, go on to the general election.
Voter registration: Voters had to register to vote in the primary by May 21. For the general election, the voter registration deadline was October 22.[2]
- See also: California elections, 2012
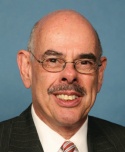
Incumbent: Heading into the election the incumbent was Henry Waxman (D), who was first elected in 1974. However, due to heavy redistricting, Waxman ran for re-election to the 33rd District.
Instead, District 27 incumbent Howard Berman and District 28 incumbent Brad Sherman competed for re-election to the 30th District in 2012.
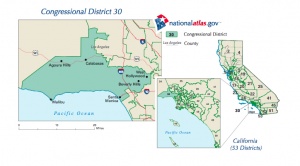
This was the first election which used new district maps based on 2010 Census data. California's 30th Congressional District is located in the southern portion of the state and includes part of Los Angeles County.[3]
Blanket primary
This was the first election year in which California's Top Two Candidates Open Primary Act was in effect. Because of this, all candidates for a seat competed in one blanket primary. The two candidates who received the most votes then advanced to the general election on November 6.
The proposition's intent was to encourage primary competition, which backers of the act said would lead to more moderate legislators being elected. The primary results did reflect an increase in competition, with California's percentage of contested primaries being much higher than the nationwide average.[4]
The increase in competition also led to an increase in campaign spending, due to the fact that competition within political parties lasted for the entire year rather than ending after the primary. Raphael J. Sonenshein, executive director of the Edmund G. "Pat" Brown Institute of Public Affairs at Cal State L.A., said the following, "It's hard to argue it's a better system where the incumbent congressman has a huge war chest and nobody else has any money... At least now we can make him spend it."[4]
As a result of the blanket primary, nine congressional districts had same-party candidates battling in the November 6 general election. Of those, seven were between Democrats.[5]
There were also over a dozen same-party races in the state legislature in November.[5]
Race background
As a result of redistricting, Democratic incumbents Brad Sherman and Howard Berman competed against each other in the 30th district. The two candidates had a total of 45 years in Congress and spent millions of dollars on the race. Because of the new top-two primary system, they both advanced beyond the primary, and the race lasted until the November 6 general election.[6]
Politico listed the 30th District race as one of the five primaries to watch in 2012.[7] It also listed the race as one of the five ugliest member vs. member battles.[8]
In addition to winning the congressional seat, chairmanship of the House Foreign Affairs Committee was available to the winner of the race if Democrats succeeded in taking back control of the U.S. House. Previously, Berman was the top Democrat on the committee and Sherman ranked 5th in seniority. However, due to a death and a retirement, Sherman moved into 2nd, behind Eni Faleomavaega, a non-voting member of American Samoa. Sherman stated that he would seek the chairmanship if he defeated Berman in November.[9]
In a debate on October 11, Berman moved over to Sherman's side of the stage and put a finger in his face. Sherman responded by putting his arm around Berman and asking "Do you want to get into this." A sheriff's deputy soon walked between the men, calming them down.[10]
Candidates
General election candidates
June 5, 2012, primary results
 Howard Berman
  District 27 incumbent[11]
 Vince Gilmore
 [[Brad Sherman]]
  District 28 incumbent[11]
 Mark Reed[12]
 Susan Shelley[12]
 Navraj Singh
 Michael Powelson
Election results
General election
| Party | Candidate | Vote % | Votes | |
|---|---|---|---|---|
| Democratic | 60.3% | 149,456 | ||
| Democratic | Howard Berman Incumbent | 39.7% | 98,395 | |
| Total Votes | 247,851 | |||
| Source: California Secretary of State "Official Election Results, 2012 General Election" | ||||
Impact of redistricting
- See also: Redistricting in California
The 30th District was re-drawn after the 2010 Census. The new district is composed of the following percentages of voters of the old congressional districts.[13][14]
- 51 percent from the 27th Congressional District
- 24 percent from the 28th Congressional District
- 25 percent from the 30th Congressional District
Registration statistics
As of October 24, 2012, District 30 had the following partisan registration breakdown according to the California Secretary of State:
| California Congressional District 30[15] | |||||||
|---|---|---|---|---|---|---|---|
| Congressional District | District Total | Democrats | Republicans | Other & Unaffiliated | Advantage | Party Advantage | Change in Advantage from 2010 |
| District 30 | 370,952 | 177,638 | 95,432 | 97,882 | Democratic | 86.14% | -35.38% |
| "Party advantage" is the percentage gap between the two major parties in registered voters. "Change in advantage" is the spread in difference of party advantage between 2010 and 2012 based on the congressional district number only. | |||||||
District partisanship
FairVote's Monopoly Politics 2012 study
- See also: FairVote's Monopoly Politics 2012
In 2012, FairVote did a study on partisanship in the congressional districts, giving each a percentage ranking (D/R) based on the new 2012 maps and comparing that to the old 2010 maps.[16]
- 2012: 64D / 36R
- 2010 Berman: 73D / 27R
- 2010 Sherman: 63D / 37R
Cook Political Report's PVI
In 2012, Cook Political Report released its updated figures on the Partisan Voter Index, which measures each congressional district's partisanship relative to the rest of the country. California's 30th Congressional District has a PVI of D+13, which is the 79th most Democratic district in the country. In 2008, this district was won by Barack Obama (D), 67-33 percent over John McCain (R). In 2004, John Kerry (D) won the district 62-38 percent over George W. Bush (R).[17]
Polls
| Brad Sherman vs. Howard Berman | |||||||||||||||||||
|---|---|---|---|---|---|---|---|---|---|---|---|---|---|---|---|---|---|---|---|
| Poll | Brad Sherman | Howard Berman | Undecided | Margin of error | Sample size | ||||||||||||||
| SurveyUSA (September 20, 2012) | 45% | 32% | 23% | +/-4 | 628 | ||||||||||||||
| Note: The polls above may not reflect all polls that have been conducted in this race. Those displayed are a random sampling chosen by Ballotpedia staff. If you would like to nominate another poll for inclusion in the table, send an email to editor@ballotpedia.org. | |||||||||||||||||||
Campaign contributions
Candidates for Congress were required to file up to seven main reports with the Federal Election Commission during the 2012 elections season. Below are candidate reports.
Howard Berman
| Howard Berman (2012) Campaign Finance Reports | |||||||||
|---|---|---|---|---|---|---|---|---|---|
| Report | Date Filed | Beginning Balance | Total Contributions for Reporting Period | Expenditures | Cash on Hand | ||||
| April Quarterly[18] | April 15, 2012 | $2,862,230.47 | $577,826.74 | $(989,203.87) | $2,450,853.34 | ||||
| Pre-Primary[19] | May 24, 2012 | $2,452,883.29 | $147,593.15 | $(1,779,115.47) | $821,360.97 | ||||
| Running totals | |||||||||
| $725,419.89 | $(2,768,319.34) | ||||||||
Brad Sherman
| Brad Sherman (2012) Campaign Finance Reports | |||||||||
|---|---|---|---|---|---|---|---|---|---|
| Report | Date Filed | Beginning Balance | Total Contributions for Reporting Period | Expenditures | Cash on Hand | ||||
| April Quarterly[20] | April 15, 2012 | $3,680,936.71 | $857,321.29 | $(475,782.55) | $4,062,475.45 | ||||
| Pre-Primary[21] | May 24, 2012 | $4,062,475.45 | $143,625.05 | $(1,200,717.25) | $3,005,383.25 | ||||
| Running totals | |||||||||
| $1,000,946.34 | $(1,676,499.8) | ||||||||
District history
| Candidate ballot access |
|---|
| Find detailed information on ballot access requirements in all 50 states and Washington, D.C. |
2010
On November 2, 2010, Henry Waxman won re-election to the United States House. He defeated Charles E. Wilkerson, Erich D. Miller, and Richard R. Castaldo in the general election.[22]
See also
- United States House of Representatives elections in California, 2012
- United States House of Representatives elections, 2012
External links

- Howard Berman campaign website
- Brad Sherman campaign website
- Mark Reed campaign website
- Susan Shelley campaign website
Footnotes
- ↑ CNN, "California Districts Race - 2012 Election Center," accessed December 1, 2012
- ↑ California Secretary of State, "Elections FAQ," accessed July 20, 2012
- ↑ California Redistricting Map, "Map" accessed September 25, 2012
- ↑ 4.0 4.1 Los Angeles Times, "Few centrists advance in California's new primary system," June 7, 2012
- ↑ 5.0 5.1 Reuters, "Democrats face Democrats in new California election system," June 6, 2012
- ↑ Sacbee.com, "Dan Walters: Redistricting, top-two primary change California's election game," March 9, 2012
- ↑ Politico, "5 primaries to watch" accessed April 18, 2012
- ↑ Politico, "Congress 2012: The 5 ugliest member vs. member battles" accessed April 18, 2012
- ↑ The Hill, "Stakes rise in primary fight between Democratic Reps. Sherman and Berman," April 11, 2012 (dead link)
- ↑ The Washington Post, "Berman-Sherman debate turns nasty, in a House race that is already heated," October 12, 2012
- ↑ 11.0 11.1 "California incumbents seek new districts to call home", washingtonpost.com, August 11, 2011
- ↑ 12.0 12.1 "Republicans join fray in Valley congressional dustup", latimes.com, September 29, 2011
- ↑ Moonshadow Mobile's CensusViewer, "California's congressional districts 2001-2011 comparison"
- ↑ Labels & Lists, "VoterMapping software voter counts"
- ↑ California Secretary of State, "Congressional Voter Registration Statistics," May 21, 2012
- ↑ "2011 Redistricting and 2012 Elections in California," September 2012
- ↑ Cook Political Report, "Partisan Voting Index Districts of the 113th Congress: 2004 & 2008" accessed October 2012
- ↑ Federal Election Commission, "Howard Berman April Quarterly," accessed July 10, 2012
- ↑ Federal Election Commission, "Howard Berman Pre-Primary," accessed July 10, 2012
- ↑ Federal Election Commission, "Brad Sherman April Quarterly," accessed July 10, 2012
- ↑ Federal Election Commission, "Brad Sherman Pre-Primary," accessed July 10, 2012
- ↑ U.S. Congress House Clerk, "Statistics of the Congressional Election of November 2, 2010," accessed March 28, 2013


