Dayton Public Schools, Ohio
Ballotpedia provides comprehensive election coverage of the 100 largest cities in America by population as well as mayoral, city council, and district attorney election coverage in state capitals outside of the 100 largest cities. This school district is outside of that coverage scope and does not receive scheduled updates.
| Dayton Public Schools |
|---|
| Dayton, Ohio |
| District details |
| Superintendent: Rhonda Corr |
| # of school board members: 7 |
| Website: Link |
Dayton Public Schools is a school district in Ohio. It was the 12th-largest school district in the state in the 2014-2015 school year and served 14,222 students.[1]
About the district
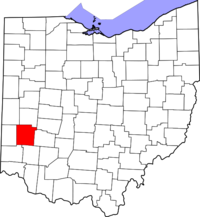
Dayton Public Schools is located in western Ohio in Montgomery County. The county seat is Dayton. The county was home to an estimated 531,239 residents from 2010 to 2016, according to the United States Census Bureau.[2]
Demographics
Montgomery County underperformed in comparison to the rest of Ohio in terms of higher education achievement from 2011 to 2015. The United States Census Bureau found that 25.7 percent of county residents aged 25 years and older had attained a bachelor's degree, compared to 26.1 percent of state residents. The median household income in Montgomery County was $43,829, while it was $49,429 for Ohio. The county poverty rate was 17.7 percent, compared to the state's 14.6 percent.[2]
| Racial Demographics, 2010-2016[2] | ||
|---|---|---|
| Race | Montgomery County (%) | Ohio (%) |
| White | 73.6 | 82.5 |
| Black or African American | 21.3 | 12.8 |
| American Indian and Alaska Native | 0.3 | 0.3 |
| Asian | 2.2 | 2.2 |
| Native Hawaiian and Other Pacific Islander | 0.1 | 0.1 |
| Two or More Races | 2.7 | 2.2 |
| Hispanic or Latino | 2.8 | 3.7 |
Note: Percentages for race and ethnicity may add up to more than 100 percent because respondents may report more than one race and the Hispanic/Latino ethnicity may be selected in conjunction with any race. Read more about race and ethnicity in the census here.
Superintendent
| |
This information is updated as we become aware of changes. Please contact us with any updates. |
The current superintendent of Dayton Public Schools is Rhonda Corr. Prior to joining the district, she served as the area superintendent in Chicago Public Schools. Corr has a bachelor's degree in Spanish, a master's degree in curriculum and instruction and special education, and an educational specialist degree from Cleveland State University.[3]
School board elections
The Dayton Board of Education consists of seven members who are elected at-large to four-year terms. The board approves compensation rates for meeting attendance during the organizational meeting after each election. Each member can be reimbursed for approved expenses incurred from conferences and training sessions.[4]
| Dayton Board of Education | ||
|---|---|---|
| Member | Assumed office | Term Ends |
| William Harris Jr. | 2017 | 2021 |
| Mohamed Al‐Hamandi | 2017 | 2021 |
| Jocelyn Rhynard | 2017 | 2021 |
| Karen Wick‐Gagnet | 2017 | 2021 |
| Robert Walker | 2011 | 2019 |
| John McManus | 2015 | 2019 |
| Sheila Taylor | 2007 | 2019 |
| |
This officeholder information was last updated on April 9, 2018. Please contact us with any updates. | |
Election dates
Members of the Dayton Board of Education are elected at-large to four-year terms on a staggered basis. Three seats were up for election on November 3, 2015, and four seats were on the ballot on November 7, 2017.
Budget
From 1993 to 2013, the Dayton school district had an average of $264,030,905 in revenue and $237,767,381 in expenditures, according to the United States Census Bureau's survey of school system finances. The district had a yearly average of $50,660,286 in outstanding debt. The district retired $6,039,095 of its debt and issued $17,035,238 in new debt each year on average.[5]
Revenue
The table below separates the district's revenue into the three sources identified by the agency: local, state, and federal.
| Revenue by Source | |||||||||||
|---|---|---|---|---|---|---|---|---|---|---|---|
| Fiscal Year |
Local | State | Federal | Revenue Total | |||||||
| Total | % of Revenue | Total | % of Revenue | Total | % of Revenue | ||||||
| Click [show] on the right to display the revenue data for prior years. | |||||||||||
|---|---|---|---|---|---|---|---|---|---|---|---|
| 1993 | $79,663,000 | 44.03% | $80,921,000 | 44.73% | $20,331,000 | 11.24% | $180,915,000 | ||||
| 1994 | $85,917,000 | 46.09% | $80,294,000 | 43.08% | $20,181,000 | 10.83% | $186,392,000 | ||||
| 1995 | $90,712,000 | 44.94% | $84,055,000 | 41.64% | $27,099,000 | 13.42% | $201,866,000 | ||||
| 1996 | $92,638,000 | 43.41% | $94,056,000 | 44.07% | $26,721,000 | 12.52% | $213,415,000 | ||||
| 1997 | $88,910,000 | 42.28% | $97,271,000 | 46.26% | $24,087,000 | 11.46% | $210,268,000 | ||||
| 1998 | $91,907,000 | 40.77% | $101,743,000 | 45.14% | $31,768,000 | 14.09% | $225,418,000 | ||||
| 1999 | $92,169,000 | 40.26% | $110,671,000 | 48.34% | $26,114,000 | 11.41% | $228,954,000 | ||||
| 2000 | $90,996,000 | 37.89% | $117,329,000 | 48.85% | $31,860,000 | 13.26% | $240,185,000 | ||||
| 2001 | $95,548,000 | 38.62% | $123,157,000 | 49.78% | $28,695,000 | 11.60% | $247,400,000 | ||||
| 2002 | $91,694,000 | 33.71% | $151,079,000 | 55.54% | $29,266,000 | 10.76% | $272,039,000 | ||||
| 2003 | $96,899,000 | 37.04% | $135,388,000 | 51.76% | $29,302,000 | 11.20% | $261,589,000 | ||||
| 2004 | $103,550,000 | 34.92% | $157,418,000 | 53.08% | $35,602,000 | 12.00% | $296,570,000 | ||||
| 2005 | $108,847,000 | 37.29% | $145,063,000 | 49.70% | $37,985,000 | 13.01% | $291,895,000 | ||||
| 2006 | $114,648,000 | 36.91% | $163,221,000 | 52.55% | $32,755,000 | 10.54% | $310,624,000 | ||||
| 2007 | $114,298,000 | 34.42% | $181,958,000 | 54.80% | $35,793,000 | 10.78% | $332,049,000 | ||||
| 2008 | $105,632,000 | 32.40% | $189,043,000 | 57.99% | $31,340,000 | 9.61% | $326,015,000 | ||||
| 2009 | $91,546,000 | 28.16% | $200,554,000 | 61.70% | $32,941,000 | 10.13% | $325,041,000 | ||||
| 2010 | $82,912,000 | 25.57% | $198,412,000 | 61.20% | $42,890,000 | 13.23% | $324,214,000 |
| 2011 | $82,935,000 | 27.16% | $174,335,000 | 57.09% | $48,083,000 | 15.75% | $305,353,000 |
| 2012 | $81,299,000 | 28.30% | $160,814,000 | 55.97% | $45,196,000 | 15.73% | $287,309,000 |
| 2013 | $89,232,000 | 32.20% | $156,718,000 | 56.55% | $31,188,000 | 11.25% | $277,138,000 |
| Avg. | $93,902,476 | 36.49% | $138,261,905 | 51.42% | $31,866,524 | 12.09% | $264,030,905 |
Expenditures
The table below separates the district's expenditures into five categories identified by the agency:
- Instruction: operation expenditures, state payments on behalf of the district for instruction and benefits, and retirement system transfers
- Support Services: support services, food services, and retirement system transfers for support service staff
- Capital Spending: capital outlay expenditures (i.e., construction, land or facilities purchases, and equipment purchases)
- Debt & Gov. Payments: payments to state and local governments and interest on school system debt
- Other: all other non-K-12 programs, except food services
| Expenditures by Category | |||||||||||
|---|---|---|---|---|---|---|---|---|---|---|---|
| Fiscal Year |
Instruction | Support Services | Capital Spending | Debt & Gov. Payments | Other | Budget Total | |||||
| Total | % of Budget | Total | % of Budget | Total | % of Budget | Total | % of Budget | Total | % of Budget | ||
| Click [show] on the right to display the expenditure data for prior years. | |||||||||||
|---|---|---|---|---|---|---|---|---|---|---|---|
| 1993 | $98,368,000 | 57.07% | $69,461,000 | 40.30% | $2,488,000 | 1.44% | $37,000 | 0.02% | $2,011,000 | 1.17% | $172,365,000 |
| 1994 | $97,518,000 | 56.52% | $70,085,000 | 40.62% | $2,945,000 | 1.71% | $39,000 | 0.02% | $1,935,000 | 1.12% | $172,522,000 |
| 1995 | $103,954,000 | 53.48% | $82,042,000 | 42.20% | $6,078,000 | 3.13% | $32,000 | 0.02% | $2,288,000 | 1.18% | $194,394,000 |
| 1996 | $104,980,000 | 52.44% | $87,949,000 | 43.93% | $4,864,000 | 2.43% | $6,000 | 0.00% | $2,403,000 | 1.20% | $200,202,000 |
| 1997 | $102,791,000 | 49.27% | $96,386,000 | 46.20% | $6,232,000 | 2.99% | $20,000 | 0.01% | $3,188,000 | 1.53% | $208,617,000 |
| 1998 | $101,113,000 | 46.81% | $101,976,000 | 47.21% | $9,919,000 | 4.59% | $1,000 | 0.00% | $2,991,000 | 1.38% | $216,000,000 |
| 1999 | $109,901,000 | 47.62% | $111,482,000 | 48.30% | $5,776,000 | 2.50% | $62,000 | 0.03% | $3,567,000 | 1.55% | $230,788,000 |
| 2000 | $100,908,000 | 46.74% | $103,105,000 | 47.75% | $6,405,000 | 2.97% | $198,000 | 0.09% | $5,295,000 | 2.45% | $215,911,000 |
| 2001 | $98,127,000 | 47.65% | $96,693,000 | 46.95% | $5,358,000 | 2.60% | $532,000 | 0.26% | $5,230,000 | 2.54% | $205,940,000 |
| 2002 | $94,214,000 | 45.30% | $99,072,000 | 47.63% | $8,709,000 | 4.19% | $505,000 | 0.24% | $5,494,000 | 2.64% | $207,994,000 |
| 2003 | $101,308,000 | 45.59% | $106,542,000 | 47.94% | $8,290,000 | 3.73% | $552,000 | 0.25% | $5,531,000 | 2.49% | $222,223,000 |
| 2004 | $101,737,000 | 41.12% | $106,032,000 | 42.85% | $32,480,000 | 13.13% | $1,481,000 | 0.60% | $5,707,000 | 2.31% | $247,437,000 |
| 2005 | $101,080,000 | 39.37% | $106,178,000 | 41.36% | $44,149,000 | 17.20% | $549,000 | 0.21% | $4,790,000 | 1.87% | $256,746,000 |
| 2006 | $104,659,000 | 36.93% | $116,130,000 | 40.98% | $57,372,000 | 20.24% | $548,000 | 0.19% | $4,681,000 | 1.65% | $283,390,000 |
| 2007 | $109,620,000 | 35.34% | $105,947,000 | 34.16% | $85,157,000 | 27.46% | $5,607,000 | 1.81% | $3,829,000 | 1.23% | $310,160,000 |
| 2008 | $94,778,000 | 29.60% | $98,557,000 | 30.78% | $116,889,000 | 36.51% | $5,993,000 | 1.87% | $3,980,000 | 1.24% | $320,197,000 |
| 2009 | $95,516,000 | 35.40% | $98,843,000 | 36.63% | $63,770,000 | 23.64% | $7,320,000 | 2.71% | $4,360,000 | 1.62% | $269,809,000 |
| 2010 | $96,123,000 | 32.15% | $101,542,000 | 33.96% | $88,814,000 | 29.70% | $8,986,000 | 3.01% | $3,533,000 | 1.18% | $298,998,000 |
| 2011 | $95,602,000 | 33.25% | $102,251,000 | 35.57% | $76,418,000 | 26.58% | $9,731,000 | 3.38% | $3,488,000 | 1.21% | $287,490,000 |
| 2012 | $92,363,000 | 37.65% | $102,659,000 | 41.85% | $38,286,000 | 15.61% | $9,086,000 | 3.70% | $2,919,000 | 1.19% | $245,313,000 |
| 2013 | $91,636,000 | 40.44% | $101,229,000 | 44.67% | $8,665,000 | 3.82% | $22,516,000 | 9.94% | $2,573,000 | 1.14% | $226,619,000 |
| Avg. | $99,823,619 | 43.32% | $98,293,381 | 41.99% | $32,336,381 | 11.72% | $3,514,333 | 1.35% | $3,799,667 | 1.61% | $237,767,381 |
Debt
The table below shows the amount of debt retired, issued, and outstanding in the district for each year.
| Debt | |||
|---|---|---|---|
| Fiscal Year |
Retired | Issued | Outstanding |
| Click [show] on the right to display the debt data for prior years. | |||
|---|---|---|---|
| 1993 | $0 | $0 | $0 |
| 1994 | $0 | $0 | $0 |
| 1995 | $0 | $0 | $0 |
| 1996 | $0 | $0 | $0 |
| 1997 | $0 | $0 | $0 |
| 1998 | $0 | $0 | $0 |
| 1999 | $0 | $0 | $0 |
| 2000 | $0 | $0 | $0 |
| 2001 | $0 | $0 | $0 |
| 2002 | $0 | $0 | $0 |
| 2003 | $0 | $0 | $0 |
| 2004 | $93,500,000 | $167,915,000 | $74,415,000 |
| 2005 | $10,625,000 | $180,140,000 | $243,930,000 |
| 2006 | $350,000 | $0 | $0 |
| 2007 | $350,000 | $0 | $0 |
| 2008 | $6,075,000 | $0 | $242,695,000 |
| 2009 | $6,275,000 | $0 | $246,420,000 |
| 2010 | $9,296,000 | $9,685,000 | $256,406,000 |
| 2011 | $350,000 | $0 | $0 |
| 2012 | $0 | $0 | $0 |
| 2013 | $0 | $0 | $0 |
| Avg. | $6,039,095 | $17,035,238 | $50,660,286 |
Teacher salaries
The starting salary for a teacher in Dayton Public Schools was $33,936 and the average salary was $53,760 during the 2011-2012 school year. Dayton Public Schools has 705 teachers with graduate degrees and 21 who have earned national board certification.[6]
Schools in district
Dayton Public Schools operates 32 K-12 schools listed below in alphabetical order:[7]
| Dayton Public Schools |
|---|
| Belle Haven PreK-8 School |
| Belmont High School |
| Charity Adams Earley Girls Academy |
| Cleveland PreK-6 School |
| David H. Ponitz Career Technology Center |
| Dayton Boys Preparatory Academy |
| Dayton Business Technology High School |
| Dayton Early College Academy |
| Dunbar Early College High School |
| Eastmont PreK-8 School |
| Edison PreK-8 School |
| Edwin Joel Brown PreK-8 School |
| Fairview PreK-8 School |
| Gardendale Academy |
| Gorman School at Jackson |
| Horace Mann PreK-8 School |
| Kemp PreK-6 School |
| Kiser PreK-8 |
| Longfellow Academy |
| Louise Troy PreK-4 School |
| Meadowdale High School |
| Meadowdale PreK-8 School |
| River's Edge Montessori PreK-6 School |
| Rosa Parks PreK-8 School |
| Ruskin PreK-8 School |
| Stivers School of the Arts |
| Thurgood Marshall High School |
| Valerie PreK-8 School |
| Westwood PreK-8 School |
| Wogaman 5-8 School |
| World of Wonder PreK-8 School at Residence Park |
| Wright Brothers PreK-8 School |
Academic performance
The Ohio Department of Education issues an annual report card for each district based on scores from the Ohio Achievement Assessments. This testing process assesses the proficiency of students in grades 3 through 8 in reading and mathematics. Students in grades 10 and 11 complete the Ohio Graduation Test to not only assess proficiency but demonstrate readiness for postgraduate life.[8][9]
Dayton Public Schools received a D on the state's Performance Index and an F in the Indicators Met section. The Ohio Department of Education found that 58.3% of students qualified as Proficient or higher. The district met proficiency levels in 8.3% of performance indicators from grades 3 through 11. The following tables detail results from the Performance Index and Indicators Met sections in the 2012-2013 district report card.[10]
| Performance Index, 2012-2013 | |
|---|---|
| Performance level | Percentage of students (%) |
| Advanced Plus | - |
| Advanced | 6.8 |
| Accelerated | 12.2 |
| Proficient | 31 |
| Basic | 36.3 |
| Limited | 23.3 |
| Untested | 0.2 |
|
| ||||||||||||||||||||||||||||||||||||||||||||||||||||||||||||||||
Contact information
![]()
Dayton Board of Education
115 S. Ludlow Street
Dayton, OH 45402
Phone: (937) 542-3000
See also
External links
Footnotes
- ↑ U.S. Department of Education, National Center for Education Statistics, "Common Core of Data, file ccd_lea_052_1414_w_0216161a, 2014-2015," accessed November 16, 2016
- ↑ 2.0 2.1 2.2 United States Census Bureau, "Montgomery County, Ohio," accessed October 19, 2017
- ↑ Dayton Public Schools, "Administration," accessed February 3, 2017
- ↑ Dayton Public Schools, "DPS Policy Manual," accessed September 16, 2013
- ↑ United States Census Bureau, "Public School System Finances: Historical Data," accessed December 1, 2015
- ↑ Cite error: Invalid
<ref>tag; no text was provided for refs namedfast - ↑ Dayton Public Schools, "All Schools," accessed September 16, 2013
- ↑ Ohio Department of Education, "FAQs," accessed September 10, 2013
- ↑ Ohio Department of Education, "Ohio Graduation Test," accessed September 10, 2013
- ↑ Ohio Department of Education, "2012-2013 Report Card for Dayton Public Schools," accessed September 16, 2013
