Visalia Unified School District, California
Ballotpedia provides comprehensive election coverage of the 100 largest cities in America by population as well as mayoral, city council, and district attorney election coverage in state capitals outside of the 100 largest cities. This school district is outside of that coverage scope and does not receive scheduled updates.
| Visalia Unified School District |
|---|
| Visalia, California |
| District details |
| Superintendent: Todd Oto |
| # of school board members: 7 |
| Website: Link |
Visalia Unified School District is a school district in California that serves the city of Visalia, California. It was the 42nd largest school district in California, serving 27,268 students in 38 schools with an operating budget of $228 million during the 2012-2013 school year.[1][2]
About the district
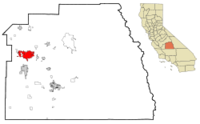
The Visalia Unified School District is located in Tulare County in south-central California. The county seat is Visalia. Tulare County was home to 459,863 residents in 2015, according to the United States Census Bureau.[3]
Demographics
Tulare County underperformed compared to California as a whole in terms of higher education achievement from 2010 to 2014. The United States Census Bureau found that 13.3 percent of county residents aged 25 years and older had attained a bachelor's degree, compared to 31 percent of state residents. The median household income for Tulare County was $42,863, compared to $61,489 for the entire state. The percentage of people in poverty in the county was 28.1 percent, compared to 16.4 percent statewide.[3]
|
| ||||||||||||||||||||||||||||||||||||||||||||||
Note: Percentages for race and ethnicity may add up to more than 100 percent because respondents may report more than one race and the Hispanic/Latino ethnicity may be selected in conjunction with any race. Read more about race and ethnicity in the census here.
Superintendent
| |
This information is updated as we become aware of changes. Please contact us with any updates. |
Todd Oto (January 2016 - Present)
Todd Oto is the superintendent of the Visalia Unified School District. He initially served as the district's interim superintendent starting in January 2016, but he was appointed full superintendent on April 26, 2016.[5]
Craig Wheaton (June 2010 - January 2016)
Craig Wheaton served as superintendent of the district from June 2010 to January 2016. Prior to serving in this role, Wheaton served as the director of state and federal Projects, the administrator of curriculum and instruction, and as an area administrator for secondary education for VUSD.[6] He left the district for a position in the Tulare County Office of Education.[7]
School board elections
The Visalia Board of Education is composed of seven members serving four-year terms.[8]
| Visalia Board of Education | |||
|---|---|---|---|
| Member | District | Assumed office | Term Ends |
| Charles Ulmschneider | Trustee Area 1 | 2009 | 2018 |
| Juan R. Guerrero | Trustee Area 2 | 2001 | 2018 |
| Jim L. Qualls | Trustee Area 3 | 1989 | 2018 |
| John L. Crabtree | Trustee Area 4 | 2013 | 2018 |
| Patricia Griswold | Trustee Area 5 | 2016 | 2020 |
| Lucia Vazquez | Trustee Area 6 | 2011 | 2020 |
| William Fulmer | Trustee Area 7 | 2007 | 2020 |
| |
This officeholder information was last updated on April 10, 2018. Please contact us with any updates. | |
Election dates
Members of the Visalia Unified Board of Education are elected to four-year terms every even-numbered year. Elections were previously held every odd-numbered year. The elections that would have been held in 2015 were postponed until 2016.[9] Four seats were up for election on November 5, 2013, and three seats were up for election on November 8, 2016.
Budget
From 1993 to 2013, the Visalia Unified School District had an average of $191,470,048 in revenue and $185,316,762 in expenditures, according to the United States Census Bureau's survey of school system finances. The district had a yearly average of $21,855,286 in outstanding debt. The district retired $2,715,048 of its debt and issued $2,901,524 in new debt each year on average.[10]
Revenue
The table below separates the district's revenue into the three sources identified by the agency: local, state, and federal.
| Revenue by Source | |||||||||||
|---|---|---|---|---|---|---|---|---|---|---|---|
| Fiscal Year |
Local | State | Federal | Revenue Total | |||||||
| Total | % of Revenue | Total | % of Revenue | Total | % of Revenue | ||||||
| Click [show] on the right to display the revenue data for prior years. | |||||||||||
|---|---|---|---|---|---|---|---|---|---|---|---|
| 1993 | $20,051,000 | 18.83% | $79,558,000 | 74.71% | $6,885,000 | 6.47% | $106,494,000 | ||||
| 1994 | $24,732,000 | 21.62% | $81,170,000 | 70.97% | $8,468,000 | 7.40% | $114,370,000 | ||||
| 1995 | $30,558,000 | 26.46% | $73,778,000 | 63.87% | $11,173,000 | 9.67% | $115,509,000 | ||||
| 1996 | $29,665,000 | 24.56% | $81,493,000 | 67.46% | $9,641,000 | 7.98% | $120,799,000 | ||||
| 1997 | $32,022,000 | 23.70% | $93,567,000 | 69.25% | $9,522,000 | 7.05% | $135,111,000 | ||||
| 1998 | $31,451,000 | 21.87% | $100,709,000 | 70.02% | $11,667,000 | 8.11% | $143,827,000 | ||||
| 1999 | $31,599,000 | 21.63% | $102,304,000 | 70.02% | $12,194,000 | 8.35% | $146,097,000 | ||||
| 2000 | $44,496,000 | 27.06% | $107,554,000 | 65.40% | $12,404,000 | 7.54% | $164,454,000 | ||||
| 2001 | $48,644,000 | 24.86% | $134,660,000 | 68.82% | $12,365,000 | 6.32% | $195,669,000 | ||||
| 2002 | $48,474,000 | 25.37% | $123,543,000 | 64.65% | $19,075,000 | 9.98% | $191,092,000 | ||||
| 2003 | $50,817,000 | 24.07% | $139,721,000 | 66.19% | $20,544,000 | 9.73% | $211,082,000 | ||||
| 2004 | $57,294,000 | 28.64% | $123,033,000 | 61.50% | $19,714,000 | 9.85% | $200,041,000 | ||||
| 2005 | $51,115,000 | 23.48% | $144,484,000 | 66.36% | $22,115,000 | 10.16% | $217,714,000 | ||||
| 2006 | $56,794,000 | 25.07% | $146,368,000 | 64.60% | $23,407,000 | 10.33% | $226,569,000 | ||||
| 2007 | $56,195,000 | 23.07% | $165,671,000 | 68.01% | $21,722,000 | 8.92% | $243,588,000 | ||||
| 2008 | $65,269,000 | 23.50% | $190,437,000 | 68.57% | $22,040,000 | 7.94% | $277,746,000 | ||||
| 2009 | $61,097,000 | 24.08% | $160,841,000 | 63.38% | $31,829,000 | 12.54% | $253,767,000 | ||||
| 2010 | $61,094,000 | 26.29% | $141,592,000 | 60.92% | $29,730,000 | 12.79% | $232,416,000 |
| 2011 | $56,633,000 | 23.80% | $150,685,000 | 63.32% | $30,659,000 | 12.88% | $237,977,000 |
| 2012 | $58,597,000 | 23.34% | $159,331,000 | 63.47% | $33,120,000 | 13.19% | $251,048,000 |
| 2013 | $58,740,000 | 24.94% | $151,556,000 | 64.35% | $25,205,000 | 10.70% | $235,501,000 |
| Avg. | $46,444,619 | 24.11% | $126,288,333 | 66.47% | $18,737,095 | 9.42% | $191,470,048 |
Expenditures
The table below separates the district's expenditures into five categories identified by the agency:
- Instruction: operation expenditures, state payments on behalf of the district for instruction and benefits, and retirement system transfers
- Support Services: support services, food services, and retirement system transfers for support service staff
- Capital Spending: capital outlay expenditures (i.e., construction, land or facilities purchases, and equipment purchases)
- Debt & Gov. Payments: payments to state and local governments and interest on school system debt
- Other: all other non-K-12 programs, except food services
| Expenditures by Category | |||||||||||
|---|---|---|---|---|---|---|---|---|---|---|---|
| Fiscal Year |
Instruction | Support Services | Capital Spending | Debt & Gov. Payments | Other | Budget Total | |||||
| Total | % of Budget | Total | % of Budget | Total | % of Budget | Total | % of Budget | Total | % of Budget | ||
| Click [show] on the right to display the expenditure data for prior years. | |||||||||||
|---|---|---|---|---|---|---|---|---|---|---|---|
| 1993 | $64,376,000 | 58.32% | $36,313,000 | 32.89% | $4,403,000 | 3.99% | $785,000 | 0.71% | $4,515,000 | 4.09% | $110,392,000 |
| 1994 | $61,517,000 | 57.42% | $31,402,000 | 29.31% | $7,618,000 | 7.11% | $867,000 | 0.81% | $5,722,000 | 5.34% | $107,126,000 |
| 1995 | $66,075,000 | 57.26% | $33,476,000 | 29.01% | $6,125,000 | 5.31% | $1,503,000 | 1.30% | $8,210,000 | 7.12% | $115,389,000 |
| 1996 | $66,869,000 | 56.32% | $37,111,000 | 31.26% | $4,109,000 | 3.46% | $1,398,000 | 1.18% | $9,245,000 | 7.79% | $118,732,000 |
| 1997 | $74,339,000 | 57.94% | $41,339,000 | 32.22% | $6,939,000 | 5.41% | $16,000 | 0.01% | $5,672,000 | 4.42% | $128,305,000 |
| 1998 | $79,810,000 | 58.60% | $42,987,000 | 31.56% | $6,385,000 | 4.69% | $821,000 | 0.60% | $6,203,000 | 4.55% | $136,206,000 |
| 1999 | $80,428,000 | 58.30% | $43,784,000 | 31.74% | $6,845,000 | 4.96% | $556,000 | 0.40% | $6,334,000 | 4.59% | $137,947,000 |
| 2000 | $89,644,000 | 56.11% | $44,629,000 | 27.94% | $18,331,000 | 11.47% | $604,000 | 0.38% | $6,552,000 | 4.10% | $159,760,000 |
| 2001 | $97,870,000 | 53.01% | $49,418,000 | 26.77% | $30,662,000 | 16.61% | $561,000 | 0.30% | $6,105,000 | 3.31% | $184,616,000 |
| 2002 | $107,624,000 | 51.18% | $62,597,000 | 29.77% | $30,351,000 | 14.43% | $1,903,000 | 0.90% | $7,813,000 | 3.72% | $210,288,000 |
| 2003 | $116,247,000 | 54.69% | $63,449,000 | 29.85% | $25,312,000 | 11.91% | $672,000 | 0.32% | $6,893,000 | 3.24% | $212,573,000 |
| 2004 | $109,317,000 | 52.68% | $64,200,000 | 30.94% | $27,046,000 | 13.03% | $1,706,000 | 0.82% | $5,242,000 | 2.53% | $207,511,000 |
| 2005 | $114,909,000 | 54.78% | $67,513,000 | 32.19% | $20,044,000 | 9.56% | $1,775,000 | 0.85% | $5,514,000 | 2.63% | $209,755,000 |
| 2006 | $121,156,000 | 54.33% | $74,410,000 | 33.36% | $20,403,000 | 9.15% | $1,110,000 | 0.50% | $5,940,000 | 2.66% | $223,019,000 |
| 2007 | $125,628,000 | 56.27% | $75,963,000 | 34.03% | $13,108,000 | 5.87% | $2,384,000 | 1.07% | $6,169,000 | 2.76% | $223,252,000 |
| 2008 | $135,267,000 | 51.25% | $81,910,000 | 31.03% | $38,810,000 | 14.70% | $1,817,000 | 0.69% | $6,134,000 | 2.32% | $263,938,000 |
| 2009 | $133,078,000 | 58.05% | $80,190,000 | 34.98% | $8,547,000 | 3.73% | $1,659,000 | 0.72% | $5,787,000 | 2.52% | $229,261,000 |
| 2010 | $133,948,000 | 57.84% | $76,483,000 | 33.03% | $14,378,000 | 6.21% | $1,518,000 | 0.66% | $5,257,000 | 2.27% | $231,584,000 |
| 2011 | $129,139,000 | 58.59% | $75,681,000 | 34.34% | $10,127,000 | 4.59% | $1,164,000 | 0.53% | $4,288,000 | 1.95% | $220,399,000 |
| 2012 | $123,684,000 | 52.96% | $76,224,000 | 32.64% | $28,085,000 | 12.02% | $1,074,000 | 0.46% | $4,492,000 | 1.92% | $233,559,000 |
| 2013 | $129,023,000 | 56.58% | $77,321,000 | 33.91% | $16,298,000 | 7.15% | $920,000 | 0.40% | $4,478,000 | 1.96% | $228,040,000 |
| Avg. | $102,854,667 | 55.83% | $58,876,190 | 31.56% | $16,377,429 | 8.35% | $1,181,571 | 0.65% | $6,026,905 | 3.61% | $185,316,762 |
Debt
The table below shows the amount of debt retired, issued, and outstanding in the district for each year.
| Debt | |||
|---|---|---|---|
| Fiscal Year |
Retired | Issued | Outstanding |
| Click [show] on the right to display the debt data for prior years. | |||
|---|---|---|---|
| 1993 | $0 | $0 | $0 |
| 1994 | $0 | $3,735,000 | $3,735,000 |
| 1995 | $0 | $0 | $3,735,000 |
| 1996 | $3,579,000 | $0 | $156,000 |
| 1997 | $156,000 | $0 | $0 |
| 1998 | $5,205,000 | $0 | $10,650,000 |
| 1999 | $0 | $0 | $10,650,000 |
| 2000 | $0 | $0 | $10,650,000 |
| 2001 | $0 | $0 | $10,650,000 |
| 2002 | $0 | $0 | $12,858,000 |
| 2003 | $0 | $10,060,000 | $22,917,000 |
| 2004 | $2,207,000 | $0 | $52,142,000 |
| 2005 | $2,290,000 | $1,182,000 | $54,803,000 |
| 2006 | $19,639,000 | $11,955,000 | $43,395,000 |
| 2007 | $3,440,000 | $0 | $39,955,000 |
| 2008 | $3,175,000 | $0 | $36,780,000 |
| 2009 | $3,390,000 | $0 | $33,390,000 |
| 2010 | $3,600,000 | $0 | $29,790,000 |
| 2011 | $3,975,000 | $0 | $25,105,000 |
| 2012 | $3,110,000 | $0 | $13,425,000 |
| 2013 | $3,250,000 | $34,000,000 | $44,175,000 |
| Avg. | $2,715,048 | $2,901,524 | $21,855,286 |
Teacher salaries
Visalia Unified School District employed 1,124 K-12 teachers during the 2011-12 school year. Teacher salaries are categorized based on higher education achievement, professional development and years of service. A teacher with a Bachelor's degree can earn higher salaries by pursuing graduate courses with raises at credit intervals. The salary schedule also accounts for graduate degrees by providing higher starting salaries and greater potential salaries. The following table details the salary schedule negotiated between the district and the Visalia Teachers Association for 2011 through 2014:[11]
| Salary structure | ||
|---|---|---|
| Degree level | Minimum salary ($) | Maximum salary ($) |
| B.A. + Permit | 41,796 | 41,796 |
| B.A. + Credential | 44,321 | 48,999 |
| B.A. + 30 | 44,321 | 57,913 |
| B.A. + 45 or M.A. | 44,536 | 71,284 |
| B.A. + 60 or M.A. + 12 | 46,272 | 78,906 |
| B.A. + 75 w/ M.A. or M.A. + 24 | 48,077 | 81,887 |
Schools in Visalia Unified School District
Enrollment
Visalia Unified School District serves 27,268 students in 18 schools.[1]
District schools
Visalia Unified School District operates 38 schools listed below in alphabetical order:[12]
| Visalia Unified School District | ||
|---|---|---|
| Name | ||
| Annie R. Mitchell | ||
| Charter Alternatives Academy | ||
| Charter Home School Academy | ||
| Conyer Elementary | ||
| Cottonwood Creek Elementary | ||
| Crestwood Elementary | ||
| Crowley Elementary | ||
| Divisadero Middle | ||
| El Diamante High | ||
| Elbow Creek Elementary | ||
| Fairview Elementary | ||
| Four Creeks Elementary | ||
| Golden Oak Elementary | ||
| Golden West Elementary | ||
| Goshen Elementary | ||
| Green Acres Middle | ||
| Highland Elementary | ||
| Houston Elementary | ||
| Hurley Elementary | ||
| Ivanhoe Elementary | ||
| La Joya Middle | ||
| Linwood Elementary | ||
| Manuel F. Hernandez | ||
| Mineral King Elementary | ||
| Mountain View Elementary | ||
| Mt. Whitney High | ||
| Oak Grove Elementary | ||
| Pinkham Elementary | ||
| Redwood High | ||
| Riverbend | ||
| Royal Oaks Elementary | ||
| Sequoia High | ||
| Valley Oak Middle | ||
| Veva Blunt Elementary | ||
| Visalia Charter Independent Study | ||
| Visalia Technical Education Center | ||
| Washington Elementary | ||
| Willow Glen Elementary | ||
Academic performance
California's Standardized Testing and Reporting (STAR) program, which includes the California Standards Tests (CST), the California Modified Assessment (CMA) and the California Alternate Performance Assessment (CAPA), measures the achievement of California content standards for grades 2-11. STAR results include English and mathematics in grades 2-11, science in grades 5 and 8-11 and history/social science in grades 8, 10 and 11. In high school, math and science tests reflect the course in which the student is enrolled. There are five STAR benchmarks to indicate a student's proficiency. "Proficient" or "Advanced" indicates that a student is meeting or exceeding state standards, which is the desired achievement goal for all students. The following table compares the percentage of district students who score at a "Proficient" or "Advanced" level with the statewide averages from the 2011-2012 school year.[13]
| STAR Performance Comparison | ||
|---|---|---|
| Subject | District average (%) | State average (%) |
| English Language Arts | 53 | 54 |
| Mathematics | 50 | 50 |
| Science | 62 | 57 |
| History/Social Science | 53 | 48 |
Contact information

Visalia Unified School District
5000 W. Cypress Ave.
Visalia, CA 93277
Phone:(559) 730-7300
See also
| California | School Board Elections | News and Analysis |
|---|---|---|
 |
 | |
External links
Footnotes
- ↑ 1.0 1.1 Ed-Data, "District Profile - Fiscal Year: 2011-12," accessed January 20, 2014
- ↑ Cite error: Invalid
<ref>tag; no text was provided for refs namedbudget - ↑ 3.0 3.1 3.2 United States Census Bureau, "Tulare County, California," accessed August 3, 2016
- ↑ Tulare County Registrar of Voters, "Prior Election Summary Reports," accessed August 1, 2014
- ↑ The Fresno Bee, "Todd Oto appointed superintendent for Visalia Unified," April 30, 2016
- ↑ KMPH.com, "Visalia Unified Interim Superintendent Announced," March 24, 2010
- ↑ Visalia Times-Delta, "Craig Wheaton leaves VUSD for position at office of ed," October 29, 2015
- ↑ Visalia Unified School District, "Board of Education," accessed January 20, 2014
- ↑ County of Tulare Board of Supervisors, "Resolution No. 2014-0901," accessed January 29, 2015
- ↑ United States Census Bureau, "Public School System Finances: Historical Data," accessed December 1, 2015
- ↑ Visalia Unified School District, "Agreement between Visalia Unified School District and Visalia Teachers Association CTA/NEA," accessed January 20, 2014
- ↑ Visalia Unified School District, "List of Schools," accessed January 20, 2014
- ↑ Ed-Data, "Student Performance - 2012," accessed January 20, 2013
| |||||
